
June 2023 Paper 1 Q12
12 This question deals with information about the populations of Local Authorities (LAs) in the North of England, taken from the 2011 census.
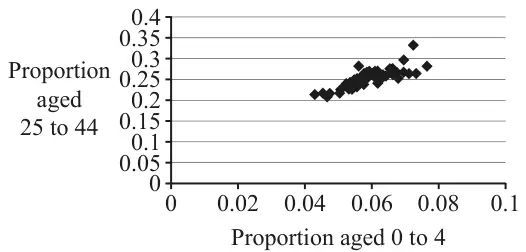
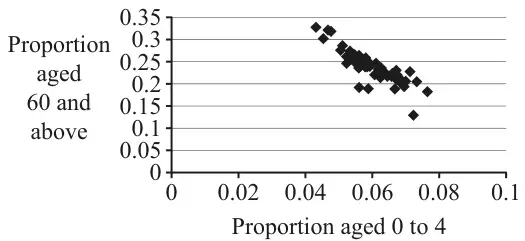
Fig. 1 and Fig. 2 both show strong correlation, but of two different kinds.
Fig. 3 is the same as Fig. 2 but with the point \(A\) marked.
Fig. 4 shows information about the same LAs as Fig. 2 and Fig. 3.
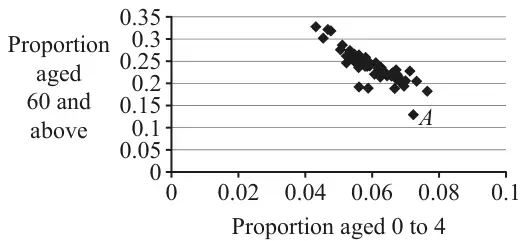
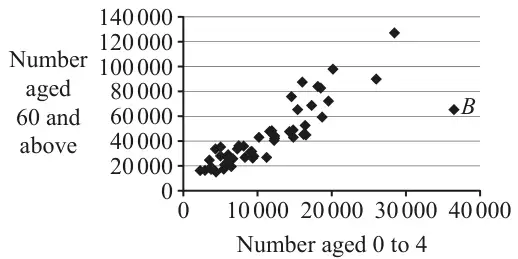
Explain how you can tell that this LA has a large population. [1]
| Scheme | Marks | AO |
|---|---|---|
| Fig 1: Positive. Fig 2: Negative | B1 | 1.2 |
| [1] |
Notes
Ignore all else
| Scheme | Marks | AO |
|---|---|---|
| Fig. 1: 25-44s have children so proportion of 0-4 is directly related to proportion of 25-44. | B1 | 2.4 |
| Fig. 2: High proportion of older people means lower proportion of families with young children | B1 | 2.4 |
| [2] |
Notes
B1 (Fig. 1): oe e.g. “25-44s more likely to be parents”
Must be in context so do not accept generic descriptions of the correlation.
B1 (Fig. 2): Oe e.g. “>60s less likely to live with young children”
Must be in context so do not accept generic descriptions of the correlation.
In both parts:
- Need not refer to proportion but may not refer to amount (i.e. do not accept answers including references to ‘amount’ or ‘number’)
- SC Max [1/2] for correct description in context but referencing ‘amount’ or ‘number’ or ‘population’
- Ignore irrelevant statements
Condone ‘children’ as shorthand for the 0-4 age group in this question (and ‘elderly’ as shorthand for the >60 age group)
| Scheme | Marks | AO |
|---|---|---|
| This LA has a similar number of >60s to many other LAs, but these represent by far the lowest proportion of its population. OR This LA has a large number of 0-4s, but its proportion of 0-4s is similar to several other LAs. (Hence must have large number in total.) | B1 | 2.4 |
| [1] |
Notes
oe. Must make a correct connection between number and proportion and compare to other LAs to show that this is one of the largest
Do not accept statements referring to 25-44 (from Fig. 1)