
June 2022 Paper 1 Q6
6 During some research the size, \(P\), of a population of insects, at time \(t\) months after the start of the research, is modelled by the following formula.
\(P = 100\mathrm{e}^{t}\)
\(P = ka^{t}\) where \(k\) and \(a\) are constants.
Some observations of \(t\) and \(P\) gave the following results.
| \(t\) | 1 | 2 | 3 | 4 | 5 |
|---|---|---|---|---|---|
| \(P\) | 100 | 500 | 1800 | 7000 | 19000 |
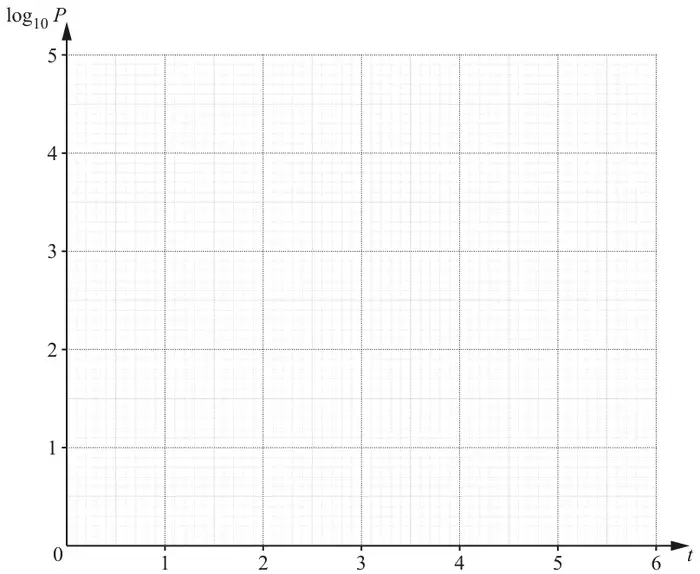
| \(\log_{10} P\) | 2.00 | 2.70 | 3.26 | 3.85 | 4.28 |
| Scheme | Marks | AO |
|---|---|---|
| (i) 5460 (3 sf) | B1 | 1.1 |
| [1] | ||
| (ii) \(9000 = 100\mathrm{e}^{t}\) \(t = \ln 90\) | M1 | 3.1a |
| \(= 4.50\) (3 sf) Allow 4.5 ISW | A1 | 1.1 |
| [2] |
Notes
(a)(ii)
M1: May be implied by answer
A1: Ignore units. Decimal answer needed
| Scheme | Marks | AO |
|---|---|---|
| (i) \(\log_{10} P = \log_{10}(ka^{t})\) | ||
| \(\log_{10} P = \log_{10} k + \log_{10}(a^{t})\) | M1 | 1.1 |
| \(\log_{10} P = \log_{10} k + t\log_{10} a\) | A1 | 1.1 |
| [2] | ||
| (ii) Points plotted correctly \(\pm 0.1\) | B1 | 1.1 |
| Line of best fit drawn, between \((1, 2.0)\) and \((1, 2.4)\) and between \((5, 4.2)\) and \((5, 4.5)\) | B1f | 1.1 |
| [2] | ||
| (iii) Read off \(c\) and attempt \(10^{c}\). May be implied by value of \(k\) | M1 | 3.1a |
| \(k = 19.9\) to \(63.1\) | A1 | 2.1 |
| Attempt gradient of their graph AND correct ft equation in \(a\). May be implied by value of \(a\) | M1 | 1.1 |
| \(a = 3.16\) to \(5.01\) (3 sf) | A1 | 1.1 |
| [4] |
Notes
(b)(i)
First line: No marks yet
M1: At least two terms correct, may be implied by next line
A1: All correct, in this form
(b)(ii)
B1: NB. May be implied by correct line of best fit
B1f: ft reasonable line through their points
(b)(iii)
M1: ft their line. Probably \(c = 1.3\) to \(1.8\), \(k = 10^{1.3}\) to \(10^{1.8}\)
M1: ft their line. Probably \(m = 0.5\) to \(0.7\) AND \(\log_{10} a = 0.5\) to \(0.7\) OR \(a = 10^{0.5}\) to \(10^{0.7}\) scores
NB Use of two points and simultaneous equations: no marks unless the two points used are on their line of best fit.
If first method used for \(k\) or \(a\) and then one point substituted in equation to find the other letter, no marks for second letter unless point used is on line of best fit.