
June 2019 Paper 2 Q10
10
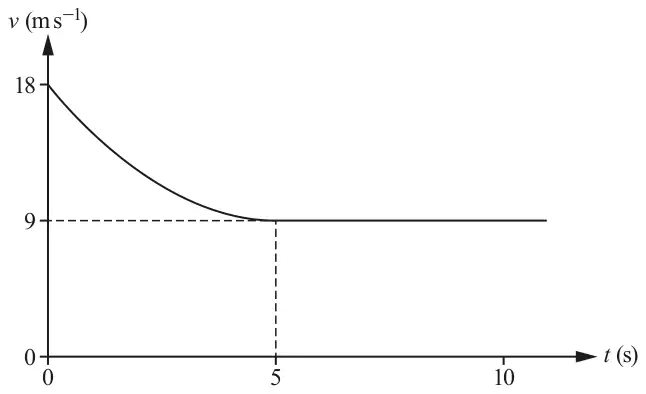
The diagram shows the velocity-time graph modelling the velocity of a car as it approaches, and drives through, a residential area.
The velocity of the car, \(v\,\text{m}\,\text{s}^{-1}\), at time \(t\) seconds for the time interval \(0 \leqslant t \leqslant 5\) is modelled by the equation \(v = pt^2 + qt + r\), where \(p\), \(q\) and \(r\) are constants.
It is given that the acceleration of the car is zero at \(t = 5\) and the speed of the car then remains constant.
| Scheme | Marks | AO |
|---|---|---|
| \(v = pt^2 + qt + r\) \(t = 0, v = 18 \Rightarrow r = 18\) | B1 | 3.4 |
| \(t = 5, v = 9 \Rightarrow 25p + 5q + 18 = 9\) | M1 | 1.1 |
| \(\dfrac{\mathrm{d}v}{\mathrm{d}t} = 2pt + q\) | B1 | 3.1b |
| \(t = 5, \dfrac{\mathrm{d}v}{\mathrm{d}t} = 0 \Rightarrow 10p + q = 0\) | M1 | 1.1 |
| \(p = \dfrac{9}{25}, q = -\dfrac{18}{5}\) | A1 | 1.1 |
| [5] |
Notes
M1: Substitutes \(t = 5, v = 9\) into quadratic. Allow with \(r\)
M1: Substitutes \(t = 5\) and sets \(\dfrac{\mathrm{d}v}{\mathrm{d}t} = 0\). Dependent on one term differentiated correctly
A1: BC (oe e.g. exact decimals)
| Scheme | Marks | AO |
|---|---|---|
| \(\displaystyle\int_{2}^{5} \left(\frac{9}{25}t^2 - \frac{18}{5}t + 18\right) \mathrm{d}t\) | M1 | 3.4 |
| \(+\,9 \times 5\) | B1 | 1.1 |
| \(= 75.24\,\text{m}\) | A1 | 1.1 |
| [3] |
Notes
M1: Using their values of \(p\), \(q\) and \(r\) in an attempt to find the distance travelled from 2 to 5 by integration
B1: For distance travelled from 5 to 10
A1: BC cao (oe)