
June 2024 Paper 2 Q3
3 A student conducts an investigation into the number of hours spent cooking per week by people who live in village A. The student represents the data in the cumulative frequency diagram below.
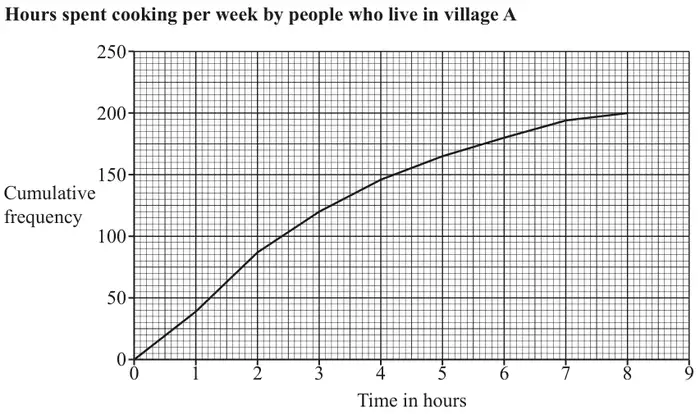
The student conducts a similar investigation into the number of hours spent cooking per week by 200 people who live in village B.
The interquartile range is found to be 3.9 hours.
| Scheme | Marks | AO |
|---|---|---|
| 200 | B1 | 1.1 |
| [1] |
| Scheme | Marks | AO |
|---|---|---|
| Horizontal lines from 150 and 50 on vertical axis to curve and vertical lines to horizontal axis | M1 | 1.1 |
| \(4.2 - 1.3 = 2.9\) | B1 | 1.1 |
| [2] |
Notes
M1: Mark the intention here – e.g. condone freehand drawn lines. Must use the diagram to score this mark. Condone values shown on the time axes
B1: allow 2.7 to 3.1 nfww. Answers in this range with no lines drawn on the diagram can score this mark provided no incorrect work seen. (M0B1 possible here).
| Scheme | Marks | AO |
|---|---|---|
| 3.9 > their 2.9 (or comparison of which IQR is higher/lower) so amount of time spent cooking by people in village B is more variable than those in village A. | B1FT | 2.2b |
| [1] |
Notes
Need to consider the statistical evidence (IQRs) here so need a comparison of values (allow implicit comparison) and a conclusion (must see the word ‘variable’)
Must be a conclusion consistent with their comparison of their values. FT their 3(b) value.
‘More variable’ is B0 (No IQRs compared)
‘More variable as it’s bigger’ is B0 (No mention of IQRs)
‘More variable as IQR is bigger’ is B1 (question asking whether B more/less variable than A in that order so not ambiguous)
Additional incorrect reasons scores B0.