
June 2024 Paper 2 Q5
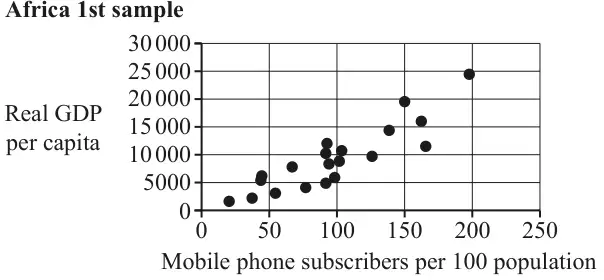
5 The pre-release material contains information for countries in the world concerning real GDP per capita in US$ and mobile phone subscribers per 100 population. In an investigation into the relationship between these two variables, a student takes a sample of 20 countries in Africa. The student draws a scatter diagram for the data, which is shown in Fig. 5.1.
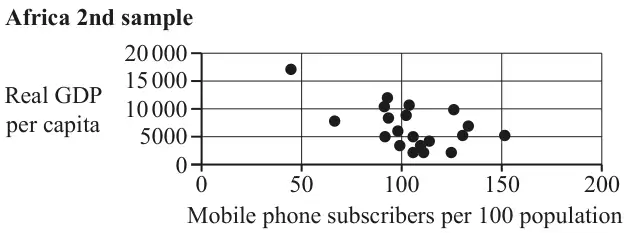
Another student collects a different sample of 20 countries from Africa, and draws a scatter diagram for the data, which is shown in Fig. 5.2.
| Scheme | Marks | AO |
|---|---|---|
| positive association or positive correlation | B1 | 2.2b |
| [1] |
Notes
May be a contextual interpretation e.g. ‘as the mobile phone subscribers per 100 population increases, real GDP per capita also increases.’
Ignore references to ‘strong/weak’ etc. ‘Linear’ not required. Contradictory statements lose the mark e.g ‘positive correlation’ followed by incorrect interpretation.
| Scheme | Marks | AO |
|---|---|---|
| negative association or negative correlation | B1 | 2.2b |
| [1] |
Notes
Accept ‘as the mobile phone subscribers per 100 population increases, real GDP per capita decreases’ o.e.
Ignore references to ‘strong/weak’ etc. ‘Linear’ not required. Contradictory statements lose the mark e.g ‘negative correlation’ followed by incorrect interpretation.
| Scheme | Marks | AO |
|---|---|---|
| Neither/None of them – samples are same size and different samples can lead to different conclusions. Or ‘Neither as the patterns of the data contrast/are different’. | B1 | 2.4 |
| [1] |
Notes
Allow e.g. neither since combining results suggests no correlation.
SC: IF they interpret (b) as ‘little/no correlation’ then they can score for a correct FT reason e.g superimposing (a) onto (b) implies no real relationship – so 2nd diagram more likely to represent the true situation.
SC: From pre-release material/large data set accept ‘the first scatter diagram is more representative of the true relationship as the PMCC is positive for this data when all countries in Africa are considered’
Any reference to sample size being too small is B0 as comparing these two scatter diagrams of equal size. e.g.
‘Neither as sample size is too small’ is B0
‘Neither as total in both samples ≠ total in Africa’ is B0
‘Neither as the patterns of the data contrast/are different’ is B1