
June 2022 Paper 2 Q5
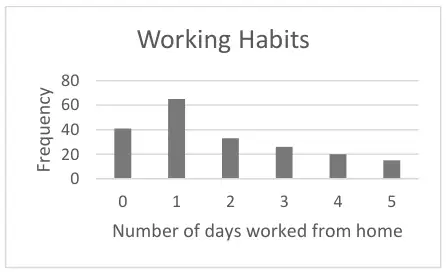
5 Ali collected data from a random sample of 200 workers and recorded the number of days they each worked from home in the second week of September 2019. These data are shown in Fig. 5.1.
| Number of days worked from home | 0 | 1 | 2 | 3 | 4 | 5 |
| Frequency | 41 | 65 | 33 | 26 | 20 | 15 |
Fig. 5.1
- The mean number of days worked from home.
- The standard deviation of the number of days worked from home. [2]
Ali then collected data from a different random sample of 200 workers for the same week in September 2019. The mean number of days worked from home for this sample was 1.94 and the standard deviation was 1.75.
Fig. 5.2 shows a cumulative frequency diagram for the ages of the workers in the first sample who worked from home on at least one day.
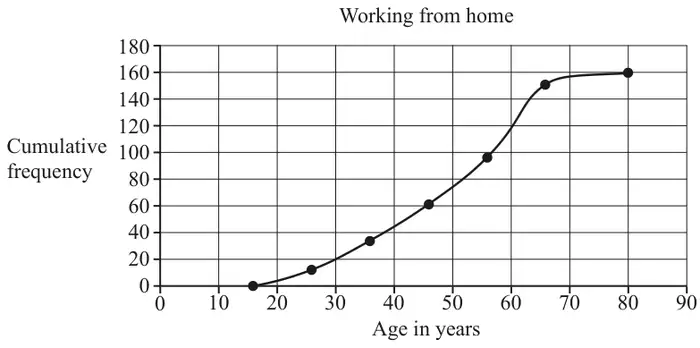
Ali concludes that 90% of the workers in this sample who worked from home on at least one day were under 60 years of age.
| Scheme | Marks | AO |
|---|---|---|
 | M1 A1 | 1.1a 1.1 |
| [2] |
Notes
M1: bar line graph (accept one bar/line missing or 1 height incorrect)
A1: Shape of heights correct and axes labelled reasonably and complete
Bars with no spaces, label in middle of bar, Crosses with vertical lines, Pie chart, Coordinates plotted but not joined not acceptable
| Scheme | Marks | AO |
|---|---|---|
| \(\bar{x} = 1.82\) | B1 | 1.1 |
| sd = 1.526 to 1.53 | B1 | 1.1 |
| [2] |
Notes
B1: BC
B1: BC. Accept 1.5224/1.52
| Scheme | Marks | AO |
|---|---|---|
| No evidence to suggest one or both samples flawed, as different random samples may lead to different results | B1 | 2.4 |
| [1] |
Notes
B1: oe …. Different samples of workers lead to different results so no
| Scheme | Marks | AO |
|---|---|---|
| Ali’s conclusion is incorrect. 120 workers aged 60 or less worked from home, and this is about 75% of 159, not 90%. | B1 | 1.2 |
| [1] |
Notes
B1: Oe compare 144 with 120 and reason
Incorrect as 90% is less than 63 years
40/160 = 25% greater than 60