
June 2022 Paper 1 Q3
3 The velocity-time graph for the motion of a particle is shown below. The velocity \(v\) \(\text{m s}^{-1}\) at time \(t\) s is given by \(v = -t^2 + 6t - 6\) where \(0 \leqslant t \leqslant 5\).
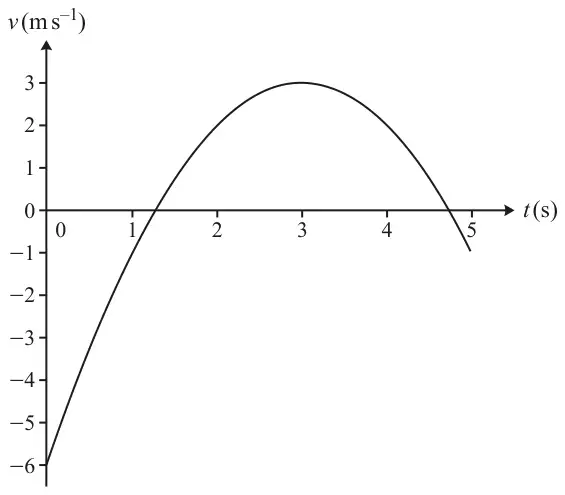
(a) Find the times at which the velocity is 2 \(\text{m s}^{-1}\). [2]
(b) Write down the greatest speed of the particle. [1]
| Scheme | Marks | AO |
|---|---|---|
| \(v = -t^2 + 6t - 6 = 2\) | M1 | 1.1a |
| \(t = 2,\ 4\) s | A1 | 1.1b |
| [2] |
Notes
M1: Use \(v = 2\) to form and attempt to solve a quadratic equation. May be implied by both correct roots
A1: Both values required
| Scheme | Marks | AO |
|---|---|---|
| 6 \(\text{m s}^{-1}\) | B1 | 1.1b |
| [1] |
Notes
B1: cao