
October 2020 Paper 2 Q3
3 A researcher is conducting an investigation into the number of portions of fruit adults consume each day. The researcher decides to ask 50 men and 50 women to complete a simple questionnaire.
The researcher represents the data in Fig. 3.1.
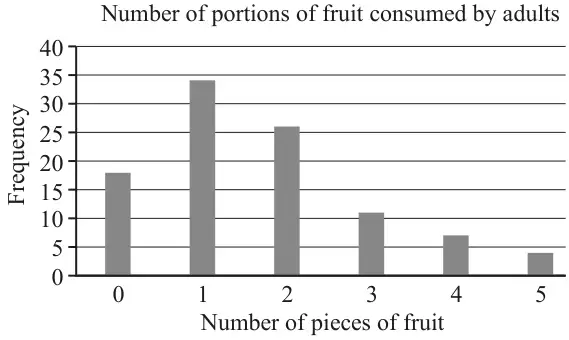
The data are summarised in the frequency table in Fig. 3.2.
| Number of portions of fruit | 0 | 1 | 2 | 3 | 4 | 5 |
| Number of adults | 18 | 34 | 26 | 11 | 7 | 4 |
Fig. 3.2
- the mean,
- the standard deviation.
A second researcher chooses a proportional stratified sample of 100 children from years 5 and 6 in a certain primary school. There are 220 children to choose from. In year 5 there are 125 children, of whom 81 are boys.
The second researcher found that the mean number of portions of fruit consumed per day by the children in this sample was 1.61 and the standard deviation was 0.53.
| Scheme | Marks | AO |
|---|---|---|
| Quota sampling | B1 | 1.2 |
| [1] |
| Scheme | Marks | AO |
|---|---|---|
| non-random | B1 | 2.4 |
| [1] |
Notes
B1: Or equivalent
Accept ‘the procedure is biased’, but not ‘those chosen might be biased’ or ‘tedious’. Ignore extra parts of explanation.
| Scheme | Marks | AO |
|---|---|---|
| Positive skew | B1 | 1.2 |
| [1] |
| Scheme | Marks | AO |
|---|---|---|
| mean is 1.67 | B1 | 1.1 |
| sd is 1.31 | B1 | 1.1 |
| [2] |
Notes
B1: CAO
B1: CAO Do not allow 1.30 or 1.3
| Scheme | Marks | AO |
|---|---|---|
| 20 | B1 | 1.1 |
| [1] |
Notes
B1: NB \(44 \times \frac{100}{220}\)
| Scheme | Marks | AO |
|---|---|---|
| (means very similar so) average number of portions of fruit consumed per child is similar to average number of portions of fruits consumed per adult | B1 | 2.2a |
| (sd for children is lower so) less variability in number of portions of fruit consumed per day by children | B1 | 2.5 |
| [2] |
Notes
B1: Condone mean for children is (slightly) less than for adults BUT must be in context of portions of fruit
ft from (d); answers must be consistent with their answers to (d) and must both be in context