
June 2019 Paper 2 Q9
9 In 2012 Adam bought a second hand car for £8500. Each year Adam has his car valued. He believes that there is a non-linear relationship between \(t\), the time in years since he bought the car, and \(V\), the value of the car in pounds. Fig. 9.1 shows successive values of \(V\) and \(\log_{10} V\).
| \(t\) | 0 | 1 | 2 | 3 | 4 |
|---|---|---|---|---|---|
| \(V\) | 8500 | 6970 | 5720 | 4690 | 3840 |
| \(\log_{10} V\) | 3.93 | 3.84 | 3.76 | 3.67 | 3.58 |
Fig. 9.1
Adam uses a spreadsheet to plot the points \((t, \log_{10} V)\) shown in Fig. 9.1, and then generates a line of best fit for these points. The line passes through the points (0, 3.93) and (4, 3.58). A copy of his graph is shown in Fig. 9.2.
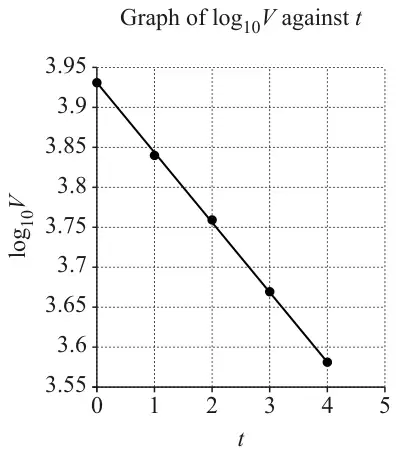
In 2017 Adam’s car was valued at £3150.
A company called Webuyoldcars pays £500 for any second hand car. Adam decides that he will sell his car to this company when the annual valuation of his car is less than £500.
| Scheme | Marks | AO |
|---|---|---|
| \(m = \dfrac{3.58 - 3.93}{4 - 0}\) | M1 | 1.1 |
| \(\log_{10} V = -0.0875t + 3.93\) | M1 A1 | 3.3 1.1 |
| [3] |
Notes
M1: (\(\pm\)) 0.0875 oe
M1: Allow any value for \(-0.0875\)
A1: condone omission of base. Condone ln
| Scheme | Marks | AO |
|---|---|---|
| \(V = 10^{-0.0875t + 3.93}\) | M1 | 3.1b |
| \(A = 10^{3.93} = 8500\) | A1 | 3.3 |
| \(b = 10^{-0.0875} = 0.82\) | A1 | 1.1 |
| [3] |
Notes
M1: Or \(\log V = \log A + \log b^t\)
A1: 8511.38
A1: Accept \(V = 8500 \times 0.82^t\). 0.81752; sc B1 if both answers not to 2 sf. Allow 8500 taken from table (M1A1)
| Scheme | Marks | AO |
|---|---|---|
| 3151.29 (\(\approx 3150\)) so the model is a (very) good fit | E1 | 3.4 |
| [1] |
Notes
E1: Must see value from model OR find value of \(t\) (approx. 4.98) when model gives 3150
Eg 3107.93 from more accurate values.
| Scheme | Marks | AO |
|---|---|---|
| \(8500 \times 0.82^t = 500\) soi | M1 | 3.1b |
| take logs of both sides | M1 | 1.1 |
| (\(t = 14.27\) so) after 15 years | A1 | 3.5a |
| [3] |
Notes
Ft from (b) for M1M1
M1: eg \(\log 8500 + \log 0.82^t = \log 500\); or \(\log 0.82^t = \log\left(\frac{500}{8500}\right)\); can be implied by 15 or 14.(…)