
June 2019 Paper 2 Q6
6 The large data set gives information about life expectancy at birth for males and females in different London boroughs. Fig. 6.1 shows summary statistics for female life expectancy at birth for the years 2012–2014. Fig. 6.2 shows summary statistics for male life expectancy at birth for the years 2012–2014.
Female Life Expectancy at Birth
| n | 32 |
|---|---|
| Mean | 84.2313 |
| s | 1.1563 |
| \(\Sigma x\) | 2695.4 |
| \(\Sigma x^2\) | 227078.36 |
| Min | 82.1 |
| Q1 | 83.45 |
| Median | 84 |
| Q3 | 84.9 |
| Max | 86.7 |
Fig. 6.1
Male Life Expectancy at Birth
| n | 32 |
|---|---|
| Mean | 80.2844 |
| s | 1.4294 |
| \(\Sigma x\) | 2569.1 |
| \(\Sigma x^2\) | 206321.93 |
| Min | 77.6 |
| Q1 | 79 |
| Median | 80.25 |
| Q3 | 81.15 |
| Max | 83.3 |
Fig. 6.2
Lorraine, who lives in Lancashire, says she wishes her daughter (who was born in 2013) had been born in the London borough of Barnet, because her daughter would have had a higher life expectancy.
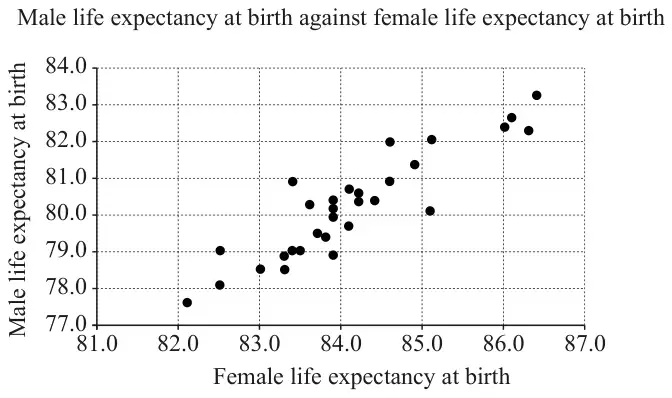
The scatter diagram in Fig. 6.3 shows male life expectancy at birth plotted against female life expectancy at birth for London boroughs in 2012–14. The outliers have been removed.
| Scheme | Marks | AO |
|---|---|---|
| Correct structure for two boxplots seen | B1 | 1.1a |
| Range correct and clear on one diagram F: 82.1 to 86.7 M: 77.6 to 83.3 | B1 | 1.1 |
| IQR correct and clear on one diagram F: 83.45 to 84.9 M 79 to 81.15 | B1 | 1.1 |
| Median correct and clear on one diagram F: 84 M: 80.25 | B1 | 1.1 |
| Both boxplots completely correct with all details shown as above | B1 | 1.1 |
| [5] |
Notes
F /M label or with key
Through template circles
| Scheme | Marks | AO |
|---|---|---|
| \(80.25 < 84\) so typical male has lower life expectancy than typical female | E1 | 2.2a |
| \(2.15 > 1.45\) OR \(5.7 > 4.6\) so life expectancy of males is more variable | E1 | 2.2a |
| [2] |
Notes
E1: OR \(80.2844 < 84.2313\) so the average life expectancy is lower for males. Or median (or mean) life expectancy for males is less than for females
E1: OR \(1.4294 > 1.1563\) so life expectancy of males is more variable. Or life expectancy for males is more variable than for females + ref to range, IQR or sd
| Scheme | Marks | AO |
|---|---|---|
| eg The LDS deals with averages, not individuals, so it does not mean that everyone in London has a longer life expectancy than everyone in Lancashire | E1 | 2.4 |
| eg There is no info available for Lancashire | E1 | 2.4 |
| [2] |
Notes
Any two valid different comments
| Scheme | Marks | AO |
|---|---|---|
| Either M: \(80.2844 \pm 2 \times 1.4294\ (= 83.1432)\) or F: \(84.2313 \pm 2 \times 1.1563 = (86.5439)\) | M1 | 1.1 |
| \(83.1(432) < 83.3\) and \(86.5(439) < 86.7\) | A1 | 2.4 |
| [2] |
Notes
M1: Correct use of criterion. 83.1(432) or 81.9(187) or 86.5(439) or 77.4(256)
A1: Both correct comparisons
| Scheme | Marks | AO |
|---|---|---|
| (linear) correlation | M1 | 2.2b |
| (strong) positive | A1 | 1.1 |
| [2] |