
June 2018 Paper 2 Q11
11 The pre-release material contains data concerning the death rate per thousand people and the birth rate per thousand people in all the countries of the world. The diagram in Fig. 11.1 was generated using a spreadsheet and summarises the birth rates for all the countries in Africa.
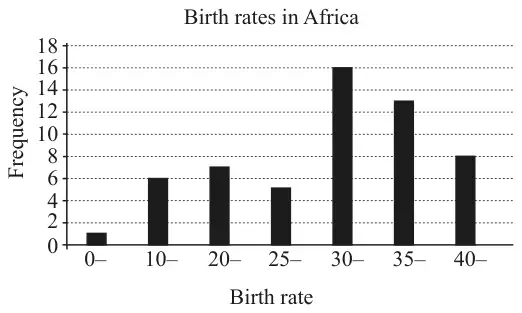
Fig. 11.2 shows a scatter diagram of death rate, \(y\), against birth rate, \(x\), for a sample of 55 countries, all of which are in Africa. A line of best fit has also been drawn.
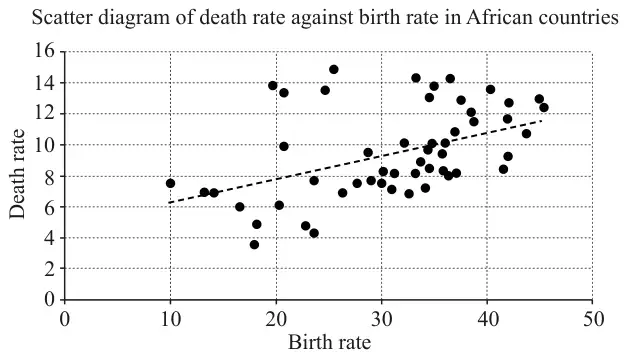
The equation of the line of best fit is \(y = 0.15x + 4.72\).
Including Togo there were 56 items available for selection.
| Scheme | Marks | AO |
|---|---|---|
| Any two distinct reasons eg classes of different widths represented by bars of same width eg vertical axis should be frequency density | E1 | 2.4 |
| eg final upper class boundary not given eg should have continuous horizontal scale / no gaps between bars | E1 | 1.1 |
| [2] |
| Scheme | Marks | AO |
|---|---|---|
| Positive correlation | B1 | 2.2b |
| [1] |
Notes
oe
| Scheme | Marks | AO |
|---|---|---|
| 9.8395 or 9.8 or 9.84 or 9.840 | B1 | 1.1 |
| [1] |
| Scheme | Marks | AO |
|---|---|---|
| extrapolation | B1 | 3.2b |
| [1] |
Notes
oe
| Scheme | Marks | AO |
|---|---|---|
| Birth rates and death rates in the Caribbean, may be very different from those in Africa. | E1 | 2.2a |
| [1] |
Notes
oe
Advantage
| Scheme | Marks | AO |
|---|---|---|
| eg other continents to select countries from | E1 | 2.2a |
| [1] |
Notes
eg a random sample would almost certainly not just include countries from Africa
Advantage
| Scheme | Marks | AO |
|---|---|---|
| Eg Generate a random number, \(n\), between 1 and 4 and select the \(n\)th item in the data set. | B1 | 1.2 |
| Eg Select every 4th item on the list thereafter (stopping when 14 have been selected) | B1 | 1.1 |
| [2] |
Notes
B1: Candidates may choose other valid starting points
B1: Candidates may choose other valid intervals