
June 2025 Mechanics Q1
1.
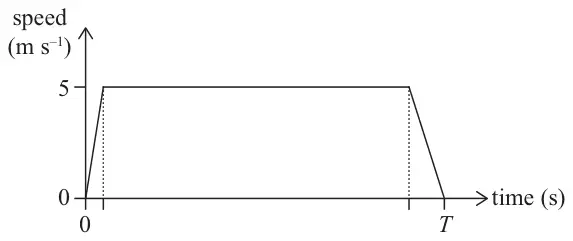
Figure 1 shows a sketch of the speed-time graph for a model of the motion of a runner travelling along a straight horizontal road from a point \(A\) to a point \(B\).
The distance from \(A\) to \(B\) is 400 metres.
In the model of the motion, the runner
- starts from rest at \(A\) at time \(t = 0\)
- then moves with constant acceleration for 5 seconds, reaching a maximum speed of \(5\ \mathrm{m\,s^{-1}}\)
- then travels at a constant speed of \(5\ \mathrm{m\,s^{-1}}\)
- then moves with constant deceleration for 15 seconds, until coming to rest at \(B\)
- travels from \(A\) to \(B\) in \(T\) seconds
(a) Find the value of \(T\). (3)
(b) State one reason why the actual time taken to travel from \(A\) to \(B\) might not be \(T\) seconds. (1)
| Scheme | Marks | AO |
|---|---|---|
| Use total distance \(= 400\) to set up an equation in \(T\) only (oe e.g. \(400 - 12.5 - 37.5 = 350,\ 350 \div 5 = 70,\ 70 + 20 = 90\)) by using area under graph and/or using suvat on each section. Must be a complete method, including use of \((T - 20)\) | M1 | 3.4 |
| \(\frac{1}{2}\big(T + (T - 20)\big) \times 5 = 400\) OR \(\frac{1}{2} \times 5 \times 5 + (T - 20) \times 5 + \frac{1}{2} \times 15 \times 5 = 400\) OR \(\frac{1}{2} \times 5 \times 5 + \frac{1}{2} \times \big(T - 5 + (T - 20)\big) \times 5 = 400\) OR \(\frac{1}{2} \times \big(T - 15 + (T - 20)\big) \times 5 + \frac{1}{2} \times 15 \times 5 = 400\) OR e.g. \(\frac{1}{2} \times 1 \times 5^2 + (T - 20) \times 5 + \left(5 \times 15 - \frac{1}{2} \times \frac{1}{3} \times 15^2\right) = 400\) (suvat) | A1 | 1.1b |
| \(T = 90\) | A1 | 1.1b |
| (3) |
Notes
M1: Must cover the total distance.
If using areas, must be using a correct formula for a triangle and/or a trapezium e.g. if \(\frac{1}{2}\) is missing then M0.
A1: Correct unsimplified equation in \(T\) (allow \(T\) replaced by e.g. \(t\) throughout)
A1: Cao, allow \(t = 90\)
| Scheme | Marks | AO |
|---|---|---|
| e.g. The change from constant acceleration to constant speed (zero acceleration) will not be instantaneous. The change from constant speed to constant deceleration will not be instantaneous. The runner is unlikely to maintain constant speed. The runner is unlikely to maintain constant acceleration or deceleration The timing(s) may not be exact. Air or wind resistance on the runner. The runner is unlikely to run in a straight line (obstacles in the road) Any physical limitation of the runner or the terrain e.g. smoothness of the road i.e. bumps in the road. The runner may run more than 400 m. Traffic on the road. | B1 | 3.5b |
| (1) | ||
| (4 marks) |
Notes
B1: Any appropriate limitation of the model.
B0 if incorrect extra answer(s) are included:
e.g. the road not being straight, friction from the road, the road not being horizontal, the road not being flat