
June 2024 Mechanics Q1
1.
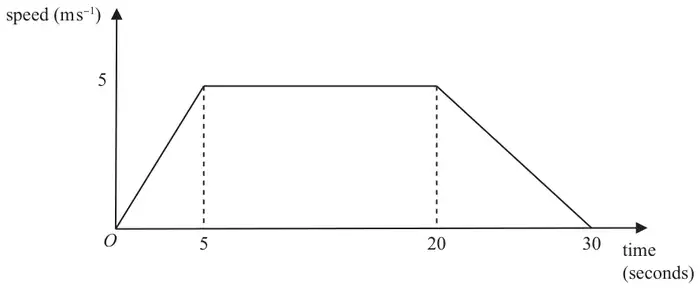
Figure 1 shows the speed-time graph for the journey of a car moving in a long queue of traffic on a straight horizontal road.
At time \(t = 0\), the car is at rest at the point \(A\).
The car then accelerates uniformly for 5 seconds until it reaches a speed of \(5\ \mathrm{m\,s^{-1}}\)
For the next 15 seconds the car travels at a constant speed of \(5\ \mathrm{m\,s^{-1}}\)
The car then decelerates uniformly until it comes to rest at the point \(B\).
The total journey time is 30 seconds.
| Scheme | Marks | AO |
|---|---|---|
| Complete method to find \(AB\) | M1 | 3.1b |
| \(= \left(\tfrac{1}{2} \times 5 \times 5\right) + (5 \times 15) + \left(\tfrac{1}{2} \times 5 \times 10\right)\) or \(= \tfrac{1}{2}(30 + 15) \times 5\) or \(= \left(\tfrac{1}{2} \times 5 \times 5\right) + \tfrac{1}{2}(25 + 15) \times 5\) or \(= \tfrac{1}{2}(20 + 15) \times 5 + \left(\tfrac{1}{2} \times 5 \times 10\right)\) or \(= (30 \times 5) - \left(\tfrac{1}{2} \times 5 \times 5\right) - \left(\tfrac{1}{2} \times 5 \times 10\right)\) | A1 | 1.1b |
| \(= 112.5\ (\mathrm{m})\) | A1 | 1.1b |
| (3) |
Notes
M1 Complete method to find the total area under the graph, with the correct structure
triangle + rectangle + triangle
or trapezium
or triangle + trapezium
or trapezium + triangle
or rectangle – triangle – triangle
N.B. They may use suvat on one or more of the sections.
A1 Correct unsimplified expression for the distance \(AB\)
A1 Accept 110 or better
| Scheme | Marks | AO |
|---|---|---|
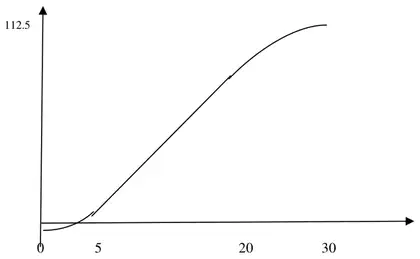 | B1 B1 B1 | 1.1b 1.1b 1.1b |
| (3) | ||
| (6 marks) |
Notes
SC: If there is a single straight line with a positive gradient, allow B1B0B0, unless it’s absolutely clear that it is for the first section only.
If there are just two straight lines, both with positive gradient, allow B1B0B0.
B1 One section correct. Straight section should be straight with positive gradient..Curves should look like curves with first one having increasing gradient and second one decreasing gradient but staying non-negative.
B1 Two sections correct. Straight section should be straight with positive gradient Curves should look like curves with first one having increasing gradient and second one decreasing gradient but staying non-negative. Continuous graph but condone incorrect transition between sections.
B1 All three sections correct and 5, 20, 30 and their 112.5 shown. Straight section should be straight with positive gradient. Curves should look like curves with first one having increasing gradient and second one decreasing gradient but staying non-negative. Continuous graph but condone incorrect transition between sections.
N.B. Subtract 1 mark from any earned if there is a continuous vertical line at the end.
Ignore any figs when awarding the first two B marks except for the SC mentioned above.