
June 2022 Statistics Q3
3. The histogram summarises the heights of 256 seedlings two weeks after they were planted.
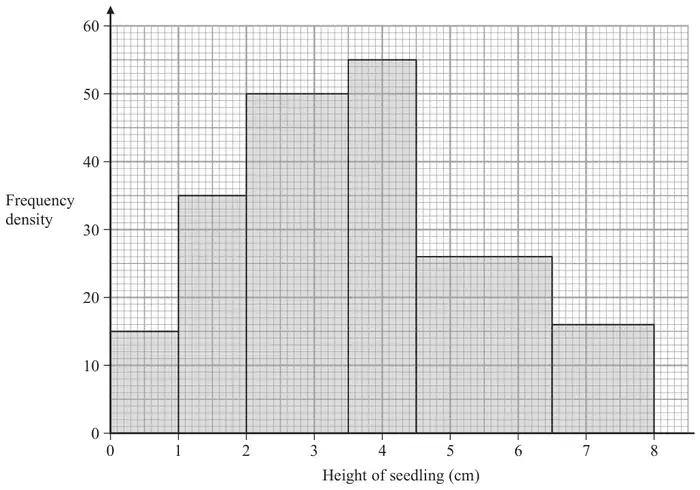
Chris decides to model the frequency density for these 256 seedlings by a curve with equation
\[y = kx(8 - x) \qquad 0 \leqslant x \leqslant 8\]where \(k\) is a constant.
Using this model,
| Scheme | Marks | AO | |||||||||||||||
|---|---|---|---|---|---|---|---|---|---|---|---|---|---|---|---|---|---|
| M1 A1 | 2.1 1.1b | |||||||||||||||
| \([Q_2 =](3.5) + \dfrac{\frac{256}{2} - \text{``}125\text{''}}{\text{``}55\text{''}} \times (4.5 - 3.5)\) or \((4.5) - \dfrac{\text{``}180\text{''} - \frac{256}{2}}{\text{``}55\text{''}} \times 1\) | M1 | 2.1 | |||||||||||||||
| \(= 3.5545\ldots\) awrt 3.55 | A1 | 1.1b | |||||||||||||||
| (4) |
Notes
1st M1 for an attempt to form frequency table (at least 1st 4 rows and freq or cum freq seen must have the frequency of 75 correct and can condone one error/omission in 15, 35, 55)
Frequencies or cum freq may be seen on bars of the histogram
1st A1 for identifying class, freq and cum freq (i.e. highlighted values from the table, shown in bold above) or sight of 3.5-4.5, freq of 55 and “128” – 125 or 180 – “128”
or diagram with 125, “128”, 180, 3.5 & 4.5
May be implied by values in 2nd M1 expression
2nd M1 for a correct calculation for \(Q_2\) (condone error in end point e.g. 3.45 or 3.49 etc)
Can ft their “125” (provided > 100) and their “55”
Allow use of \((n + 1)\), usually see 128.5 – … leading to 3.5636… or awrt 3.56
2nd A1 awrt 3.55 but 3.555 is fine (allow 3.56 if \((n + 1)\) being used …need sight of \(\frac{257}{2}\) etc)
Correct answer with no incorrect working scores 4/4
| Scheme | Marks | AO |
|---|---|---|
| Need area under curve to be 256 so \(\displaystyle\int_{(0)}^{(8)} kx(8 - x)\,\mathrm{d}x = 256\) | M1 | 3.1a |
| \(k\left[4x^2 - \dfrac{x^3}{3}\right]_{(0)}^{(8)} = 256\) | M1 | 1.1b |
| \(\left\{k\left[4 \times 8^2 - \frac{8}{3} \times 8^2\right] = 256 \Rightarrow\right\}\) \(k = 3\) | A1 | 1.1b |
| (3) |
Notes
1st M1 for identifying the need to find the area under the curve by integrating
2nd M1 for correct integration and \(= 256\) (condone missing limits)
A1 for \(k = 3\) [May see use of calculator for the integration so score 2nd M1A1 together]
| Scheme | Marks | AO |
|---|---|---|
| [By symmetry median = ] 4 | B1 | 2.2a |
| (1) | ||
| (8 marks) |
Notes
NB The answer to part (c) may be written within the question.
B1 for 4 (Independent of their value of \(k\) but must be their “\(x\)” value)
NB when \(k = 0.25\) and \(x = 4\) gives \(y = 4\) so must be clear they intend median = 4
The statement in part (c) “\(k = 4\)” is B0