
November 2021 Statistics Q1
1.
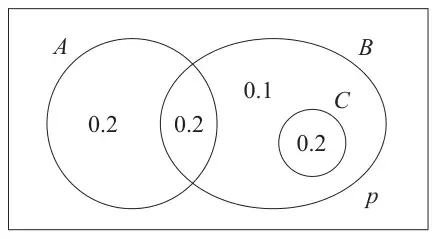
The Venn diagram, where \(p\) is a probability, shows the 3 events \(A\), \(B\) and \(C\) with their associated probabilities.
(a) Find the value of \(p\). (1)
(b) Write down a pair of mutually exclusive events from \(A\), \(B\) and \(C\). (1)
| Scheme | Marks | AO |
|---|---|---|
| \([\,p = 1 - (0.2 + 0.2 + 0.1 + 0.2)\,] = \underline{\mathbf{0.3}}\) | B1 | 1.1b |
| (1) |
Notes
B1 for 0.3
| Scheme | Marks | AO |
|---|---|---|
| \(A\) and \(C\) are mutually exclusive. [ NOT \(\mathrm{P}(A)\) and \(\mathrm{P}(C)\) ] | B1 | 1.2 |
| (1) | ||
| (2 marks) |
Notes
B1 for \(A\) and \(C\) [NB \(A \cap C\) or \(A \cap C = \varnothing\) is B0 ]
If more than one case given they must all be correct e.g. \(A \cap B\) and \(C\)