
November 2021 Paper 1 Q13
13.
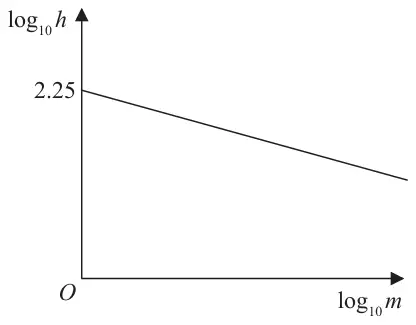
The resting heart rate, \(h\), of a mammal, measured in beats per minute, is modelled by the equation
\[h = pm^q\]where \(p\) and \(q\) are constants and \(m\) is the mass of the mammal measured in kg.
Figure 2 illustrates the linear relationship between \(\log_{10}h\) and \(\log_{10}m\)
The line meets the vertical \(\log_{10}h\) axis at 2.25 and has a gradient of \(-0.235\)
A particular mammal has a mass of 5 kg and a resting heart rate of 119 beats per minute.
| Scheme | Marks | AO |
|---|---|---|
| \(\log_{10}h = 2.25 - 0.235\log_{10}m\) \(\Rightarrow h = 10^{2.25 - 0.235\log_{10}m}\) \(\Rightarrow h = 10^{2.25} \times m^{-0.235}\) or \(h = pm^q\) \(\Rightarrow \log_{10}h = \log_{10}p + \log_{10}m^q\) \(\Rightarrow \log_{10}h = \log_{10}p + q\log_{10}m\) | M1 | 1.1b |
| Either one of \(p = 10^{2.25}\quad q = -0.235\) Or either one of \(\log_{10}p = 2.25\quad q = -0.235\) | A1 | 1.1b |
| \(\Rightarrow p = 178\) and \(q = -0.235\) | A1 | 2.2a |
| (3) |
Notes
M1: Establishes a link between \(h = pm^q\) and \(\log_{10}h = 2.25 - 0.235\log_{10}m\).
May be implied by a correct equation in \(p\) or \(q\)
A1: For a correct equation in \(p\) or \(q\)
A1: \(p = 178\) and \(q = -0.235\)
| Scheme | Marks | AO |
|---|---|---|
| \(h = \text{``}178\text{''} \times 5^{\text{``}{-}0.235\text{''}}\) or \(\log_{10}h = \text{``}2.25\text{''} - \text{``}0.235\text{''}\log_{10}5\) | M1 | 3.1b |
| \(h = 122\) | A1 | 1.1b |
| Reasonably accurate (to 2 sf) so suitable | A1ft | 3.2b |
| (3) |
Notes
M1: Uses either model to set up an equation in \(h\) (or \(m\))
A1: \(h\) = awrt 122. Condone \(h\) = awrt 122 bpm
A1ft: Comments on the suitability of the model. Follow through on their answer.
Requires a comment consistent with their answer from using the model.
E.g. It is a suitable model as it is only “3” bpm away from the real value ✓
Do not allow an argument stating that it should be the same.
It is an unsuitable model as “122” bpm is not equal to 119 bpm ✗
| Scheme | Marks | AO |
|---|---|---|
| "\(p\)" would be the (resting) heart rate (in bpm) of a mammal with a mass of 1 kg | B1 | 3.4 |
| (1) | ||
| (7 marks) |
Notes
B1: "\(p\)" would be the (resting) heart rate of a mammal with a mass of 1 kg