
Numeracy Intermediate June 2017 Unit 2 Q4
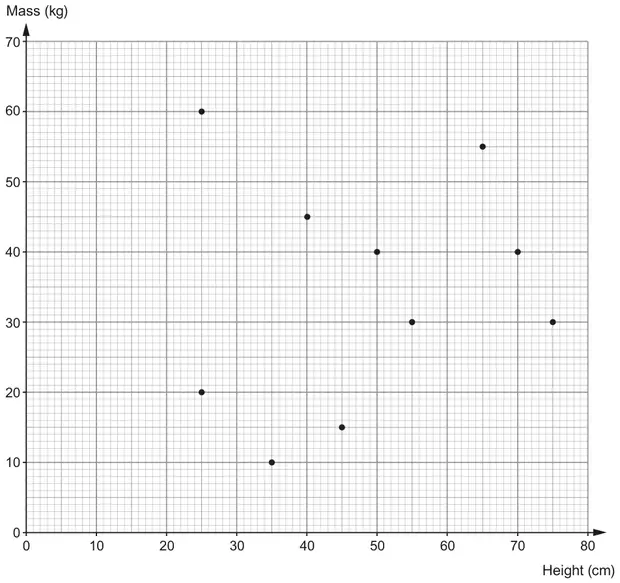
4. A group of friends measured the heights and masses of their pets.
The scatter diagram shows the results.
(a)
Describe the correlation shown by this scatter diagram. [1]
(b)
The friends notice that the tallest pet has the same mass as another pet.
What is the height of this other pet? [1]
…………… cm
| Scheme | Marks | Comments |
|---|---|---|
| No correlation or none | B1 | Accept a description, e.g. 'there is no relationship', ‘no trend’, ‘height and mass do not depend on each other’ Allow, e.g. ‘not negative or positive’ Do not accept, e.g. ‘scattered’, ‘neutral’, ‘spread out’, ‘random’, ‘indirect’, ‘no pattern’ |
| Scheme | Marks | Comments |
|---|---|---|
| 55 cm | B1 |