
Numeracy Higher November 2020 Unit 2 Q7
7. On Wednesday, there were no cars in a car park when it opened at 7:00 a.m.
From 7:00 a.m., the number of cars entering the car park was recorded.
The cumulative frequency diagram has been drawn from the results.
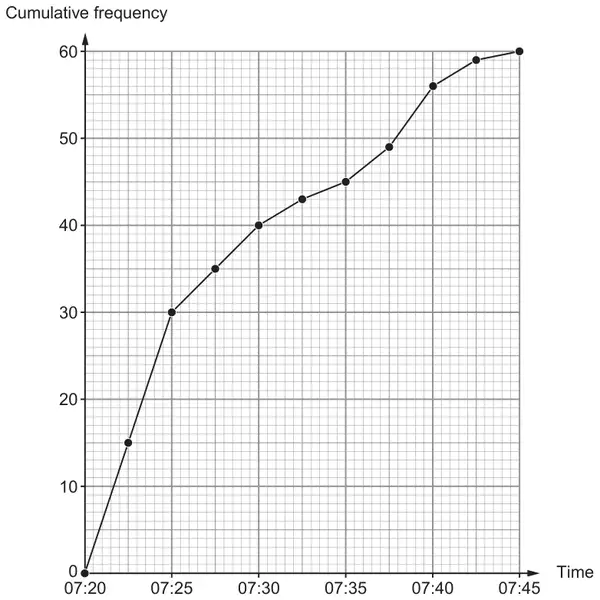
(a) How many cars had entered the car park by 7:35 a.m.? [1]
(b) The first car entered the car park at 7:21 a.m.
The last car entered the car park at 7:44 a.m.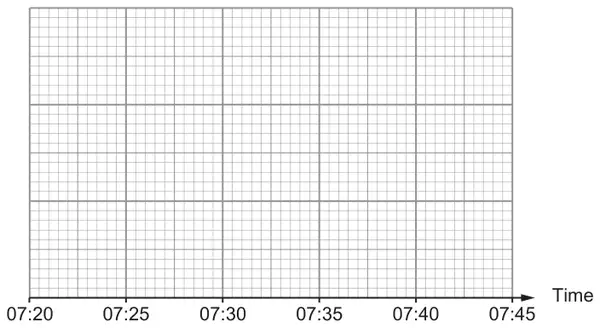
The last car entered the car park at 7:44 a.m.
Draw a box-and-whisker plot using this information and the data from the cumulative frequency diagram. [3]
| Scheme | Marks | Comments |
|---|---|---|
| 45 (cars) | B1 |
| Scheme | Marks | Comments |
|---|---|---|
| Range correct (07:21 and 07:44) | B1 | Allow 07:21 to 07:22 and 07:44 to 07.45 |
| UQ and LQ correct (07:22.5 and 07:35) | B1 | Accept seen in working if not given on the box-and-whisker |
| Median correct (07:25) | B1 | Accept seen in working if not given on the box-and-whisker Penalise -1 if the structure of the box-and-whisker plot is not correct, ignore if end vertical lines not shown for whiskers |