
Numeracy Higher November 2019 Unit 1 Q8
8. A boat company runs trips from Tenby to Caldey Island every day during the summer.
The company wants to provide services suited to its passengers. On one day, the company recorded the ages of its passengers.
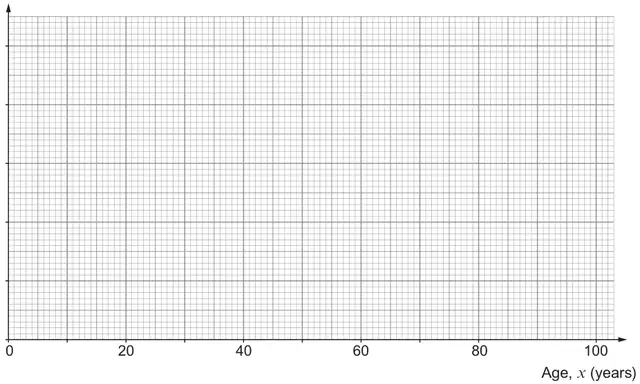
The table below shows the frequency densities of the different age groups recorded.
| Age, \(x\) (years) | Frequency density |
|---|---|
| \(0 \leqslant x \lt 20\) | 1·8 |
| \(20 \leqslant x \lt 35\) | 2·4 |
| \(35 \leqslant x \lt 50\) | 2 |
| \(50 \leqslant x \lt 70\) | 1·5 |
| \(70 \leqslant x \lt 100\) | 0·6 |
Next week, the boat company will give out a questionnaire.
The questionnaire will be given to a random sample of passengers from the first 40 passengers who board the boat.
Use the following list of random numbers to select a sample of 6 passengers from these 40 passengers.
You must start with the first number in the list.
Explain clearly how you are using the numbers to select the sample. [3]
| 4120 | 0558 | 8945 | 9111 | 7539 |
| 5286 | 6020 | 3730 | 5032 | 9937 |
Passengers chosen ……… ……… ……… ……… ……… ………
| Scheme | Marks | Comments |
|---|---|---|
| 1.8×20 + 2.4×15 + 2×15 + 1.5×20 + 0.6×30 (36) (36) (30) (30) (18) | M1 | Allow M1 for the sum of any 3 correct products |
= 150 | A1 | CAO |
| (Estimate of number of passengers \(\geqslant\) 60 =) 33 | B1 | FT their \(\dfrac{\text{‘}1.5\times 20\text{’}}{2}\) + their ‘0.6×30’ |
| (Percentage of passengers \(\geqslant\) 60 =) \(\dfrac{33}{150}\) (× 100) | m1 | FT ‘their derived 33’ from working with frequencies and ‘their 150’ provided M1 previously awarded |
= 22 (%) | A1 | On FT, needs to be in its simplest form If they give a decimal answer, it needs to be correct to the nearest whole number when rounded or truncated Mark final answer |
| Scheme | Marks | Comments |
|---|---|---|
| Uniform scale starting at 0 up to at least 2.4 AND a label of ‘Frequency density’ on the vertical axis | B1 | Use overlay provided Condone omitting 0 on the vertical axis Allow 2 numbers only (other than 0) given on the vertical axis showing a uniform scale |
| Correct bars of height 1.8, 2.4, 2, 1.5, 0.6 | B2 | B1 for any 3 correct bars |
| Scheme | Marks | Comments |
|---|---|---|
Statements required:
| E2 | All 4 needed for E2 E1 for any 2 or 3 correct statements Allow an equivalent numbering system e.g. (0)0 to 39 Their numbering system can be implied by the range of numbers they state they will choose from Allow the 2nd statement to be implied by their numbering of the passengers (from 01) AND their use of 2 digit numbers in their answer OR 2 digit numbers used in their answer and 05 seen e.g. Do not use 00 and 41 – 99, OR Use the numbers (0)1 to 40 Do not allow ‘Use numbers less than 40’ if they have numbered the passengers from 01 to 40 |
| (Working in rows would give passengers) 20, (0)5, 11, 39, (Working in columns would give passengers) 20, (0)5, | B1 |
Alternative
Alternative method:
| Scheme | Marks | Comments |
|---|---|---|
| E2 | All 4 needed for E2 E1 for any 2 or 3 correct statements Allow an equivalent numbering system e.g. (0)0 to 39 Their numbering system can be implied by the range of numbers they state they will choose from Allow the 2nd statement to be implied by their numbering of the passengers (from 01) AND their use of 2 digit numbers in their answer OR 2 digit numbers used in their answer and 01 or 05 seen If (0)0 to 39 used, when the remainder is 0, passenger 00 is selected) |
| (Working in rows would give passengers) (0)1, 20, (0)5, 18, (Working in columns would give passengers) (0)1, 20, 12, | B1 |