9. The time taken to run 400 m was recorded for each member of a running club.
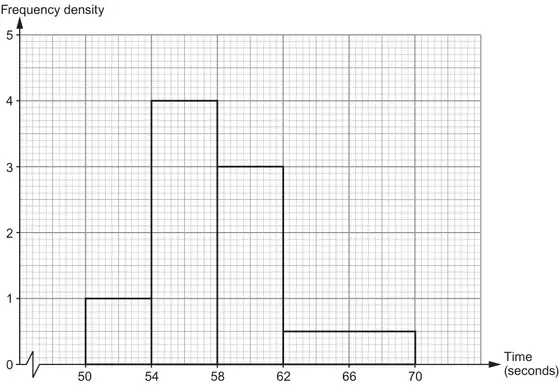
(a) A histogram of the results for the members who are under 30 years of age is shown below.
(i) Calculate how many members of the running club are under 30 years of age. [2]
(ii) Calculate an estimate of the median time taken by the under-30s to run 400 m. [4]
(b) The frequency table below shows the results for the members who are 30 years of age or over.
Time, \(t\) (seconds)
\(50 \lt t \leqslant 54\)
\(54 \lt t \leqslant 58\)
\(58 \lt t \leqslant 60\)
\(60 \lt t \leqslant 62\)
\(62 \lt t \leqslant 70\)
Number of people
4
10
16
18
12
Frequency density
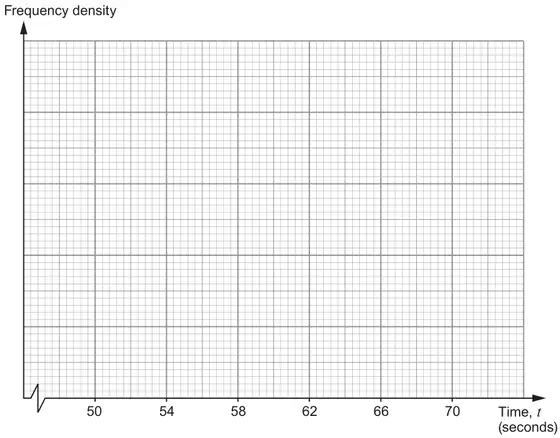
Complete the table, and draw a histogram to illustrate this data on the graph paper below. [4]
(c) On average, which of the two groups was faster at running 400 m? Give a reason for your answer. Your reason must be based on your interpretation of the histograms. [1]
Mark scheme (a)
Scheme
Marks
Comments
(i) 4×1 + 4×4 + 4×3 + 8×0·5
M1
Allow M1 for any 3 correct products
= 36
A1
CAO
(ii)
FT for all marks from their answer to (a)(i) provided their work in (a)(ii) is of equivalent difficulty. If FT results in the median being at one the group boundaries, then award a possible S1 only if correctly found
Median is in the group 54 to 58
S1
May be implied in their answer
4x = 14 OR 4x = 2
M1
OR \(\frac{14}{16}\) × 4 OR \(\frac{2}{16}\) × 4
x = 3·5 or equivalent OR x = 0·5 or equivalent
A1
(Estimated median =) 57·5 (sec) or equivalent
A1
Alternative method (a)(ii)
S1 for median group of 54 to 58 M1 for \(\frac{14{\cdot}5}{16}\) × 4 OR \(\frac{1{\cdot}5}{16}\) × 4 (finding the 18·5th time) A1 for 3·6(25) OR 0·3(75) A1 for 57·6(25) (sec)
Mark scheme (b)
Scheme
Marks
Comments
Freq densities of 1, 2·5, 8, 9, 1·5
B2
B1 for any 2 correct
Suitable uniform vertical scale
B1
Up to ‘their maximum frequency density’ provided correct divisions attempted i.e. frequency ÷ class width
Correct bars drawn
B1
FT provided at least B1B0 B1 awarded
Mark scheme (c)
Scheme
Marks
Comments
Under-30s quicker AND reason e.g. 'Higher proportion for under 58 seconds compared to over 58 seconds', ‘Smaller proportion for 58 to 70 seconds compared to 50 to 58’ ‘Higher bars for the quicker times’, ‘Median for 30-and-overs was 60 seconds’, ‘Under-30s have a quicker modal group’
E1
If values or groups are given in their reason, they need to be correct.
Allow reasons e.g. ‘More under 58 seconds’ ‘The peak for the under-30s is lower than the 30-and-overs’
Do not accept reasons e.g. ‘Higher frequency for 54 to 58 seconds’ ‘Under-30s have a lower average time’ ‘The frequency densities reached higher for the under 30s’ ‘Their histogram is more to the left’
We'd like to use Google Analytics cookies to count visits and see which pages help most. They're optional, and the site works exactly the same either way. Privacy policy