
Numeracy Foundation November 2016 Unit 1 Q2
2. A flight to New York had 450 passengers.
A survey was completed to see what the 450 passengers did for most of their time during the flight.
- 120 passengers watched films
- 60 passengers played games
- 130 passengers listened to music
- 30 passengers read a book
- The rest slept.
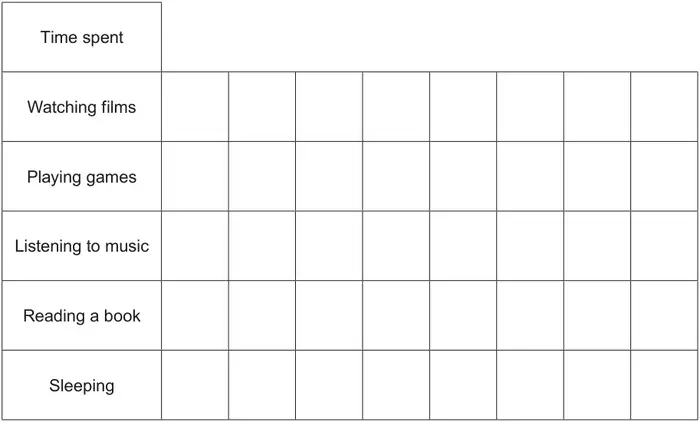
Draw a pictogram to represent what the 450 passengers did for most of their time during the flight to New York. [5]
Key:  represents 20 passengers.
| Scheme | Marks | Comments |
|---|---|---|
| 450 – (120 + 60 + 130 + 30) 110 passengers slept seen or implied in diagram Correct pictogram drawn 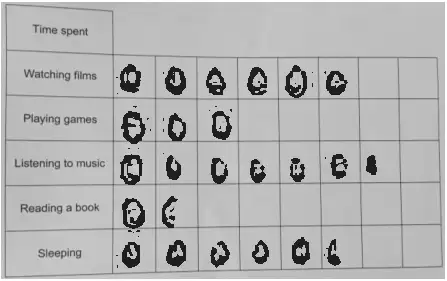 | M1 A1 B3 | FT ‘their 110’ provided it is seen. B2 for 3 or more independent rows drawn correctly B1 for 2 independent rows drawn correctly Completely correct pictogram with no workings for 110 shown gets M1A1B3 Penalise -1 only for consistent use of a different symbol. |