
Intermediate November 2016 Unit 2 Q16
16. A factory uses a machine to produce electrical sockets.
The manager carries out a survey to investigate the probability of the machine producing a defective socket.
The relative frequency of defective sockets produced was calculated after testing a total of 1000, 2000, 3000, 4000 and 5000 sockets.
The results are plotted on the graph below.
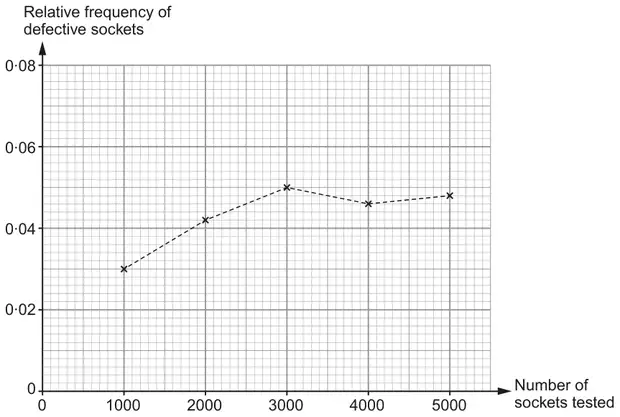
(a) How many of the first 3000 sockets tested were defective? [2]
(b) Write down the best estimate for the probability that one socket, selected at random, will be defective.
You must give a reason for your choice. [2]
You must give a reason for your choice. [2]
Probability: …………………………
Reason: ……………………………………………………
| Scheme | Marks | Comments |
|---|---|---|
| 3000 × 0·05 or equivalent. | M1 | Allow 5% of 3000 for the M1. |
| = 150 | A1 | C.A.O. SC1 for sight of 3000 × 0·05 (= 150) within an incorrect solution. e.g. 1000 × 0·03 + 2000 × 0·042 + 3000 × 0·05 +… (= 30 + 84 + 150 + …..) |
| Scheme | Marks | Comments |
|---|---|---|
| 0·048 or equivalent e.g. 4·8% or 240/5000 | B1 | ISW from an answer given as a fraction. |
| Explanation e.g. ‘all data used’, ‘last point plotted’, ‘the number of sockets tested was the highest’. | B1 | Accept any indication that the final reading should give the best estimate. |