
Higher June 2022 Unit 2 Q14
14. The graph of \(y = 12 + x - x^2\), for values of \(x\) from \(x = 0\) to \(x = 4\), is drawn below.
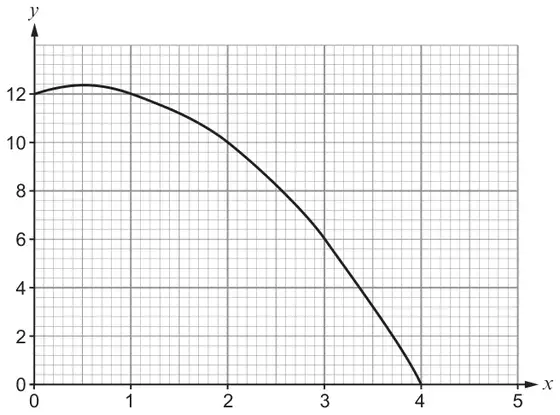
Use the trapezium rule, with the ordinates \(x = 0\), \(x = 1\), \(x = 2\), \(x = 3\) and \(x = 4\), to estimate the area of the region bounded by the curve, the positive \(x\)-axis and the positive \(y\)-axis. [3]
From the formula list: Area of trapezium \(= \dfrac{1}{2}(a+b)h\)
| Scheme | Marks | Comments |
|---|---|---|
| (Area=) \(\dfrac{1}{2} \times [12+0+2(12+10+6)]\) | M2 | Award M1 for 4 or more values correct and up to 1 incorrect OR all values correct but h≠1. |
| = 34 | A1 | F.T. from M1 provided h is correct. Ignore units. Condone 342 if offered as a final answer. |
14. Alternative method:
| Scheme | Marks | Comments |
|---|---|---|
| (Area=) \(\frac{(12+12)\times 1}{2} + \frac{(12+10)\times 1}{2} + \frac{(10+6)\times 1}{2} + \frac{(6+0)\times 1}{2}\) (= 12 + 11 + 8 + 3) | M2 | ×1 not required. Each area may be seen as the sum of the area of a rectangle and a triangle. M1 for the sum of these 4 areas with 1 error (may be repeated) in the substitution of these values. Condone missing brackets for M2 or M1 provided subsequent working leads to the appropriate values. |
| = 34 | A1 | F.T. from M1 provided h is correct. Ignore units. Condone 342 if offered as the final answer. Treat splitting area into 8 parts as MR-1. If no marks awarded, award SC1 for sight of 12, 11, 8 and 3 (not in a sum). |