
Higher November 2018 Unit 1 Q18
18. The graph shows a sketch of the curve with equation \(y = x^2 + 2\).
The lowest point of the curve has coordinates (0, 2).
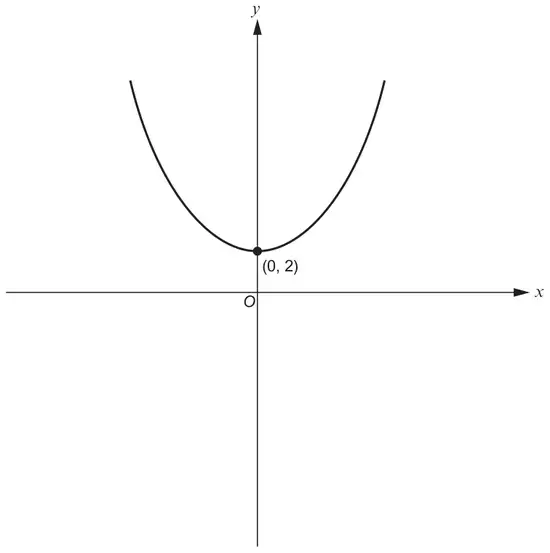
On the same axes, sketch the graph of the curve with equation \(y = (x - 4)^2 + 2\).
Indicate clearly the coordinates of the lowest point on the new curve. [2]
| Scheme | Marks | Comments |
|---|---|---|
| Translation horizontally to the right (only) | B1 | |
| (4, 2) indicated correctly. | B1 | Minimum point at (4, 2). SC1 for left shift with (-4, 2) indicated. |