
June 2024 Unit 2 Q5
5. In March 2020, the coronavirus pandemic caused major disruption to the lives of individuals across the world. A newspaper published the following graph from the gov.uk website, along with an article which included the following excerpt.
“The daily number of vaccines administered continues to fall. In order to get control of the virus, we need the number of people receiving a second dose of the vaccine to keep rocketing. The fear is it will start to drop off soon, which will leave many people still unprotected.”
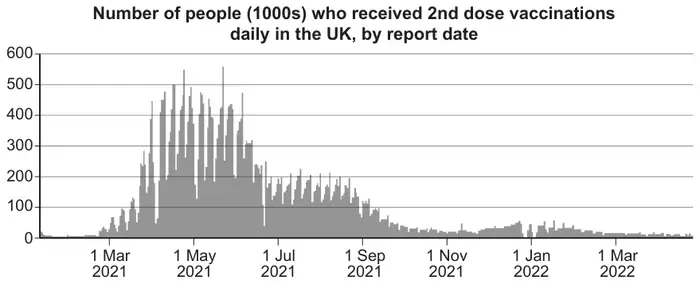
The daily numbers of second dose vaccines, in thousands, over the period April 1st 2021 to May 31st 2021 are shown in the table below.
| Daily number of 2nd dose vaccines (1000s) | Midpoint \(x\) | Frequency \(f\) | Percentage |
|---|---|---|---|
| \(0\leqslant v\lt 100\) | 50 | 2 | 3·3 |
| \(100\leqslant v\lt 200\) | 150 | 8 | 13·1 |
| \(200\leqslant v\lt 300\) | 250 | 10 | 16·4 |
| \(300\leqslant v\lt 400\) | 350 | 13 | 21·3 |
| \(400\leqslant v\lt 500\) | 450 | 26 | 42·6 |
| \(500\leqslant v\lt 600\) | 550 | 2 | 3·3 |
| Total | 61 | 100 |
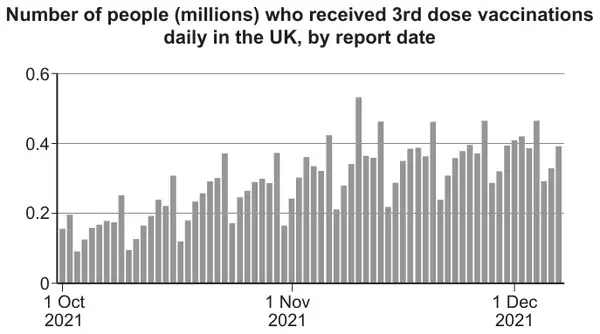
A second graph in the article shows the number of people receiving a third dose of the vaccine. This graph has a repeated pattern of rising then falling. An extract is shown below.
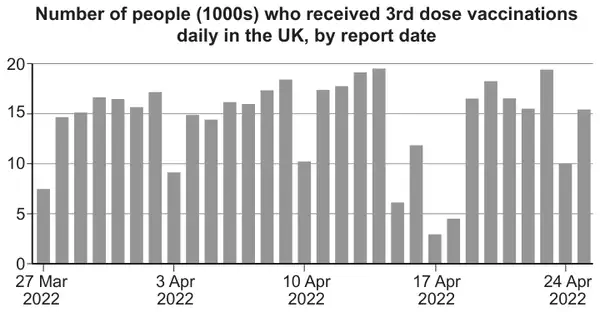
Another extract shows the number of people who received the third dose of the vaccine between 27th March 2022 and 25th April 2022.
| Scheme | Marks | Comments |
|---|---|---|
Valid explanation, e.g.,
| E1 | E0 for “Vaccines increased from March to May 2021” or “There are sections of the graph where number of vaccines increase.” E1 “less people need a second dose because they’ve had it already.” No requirement to reference the quote directly. |
| [1] |
| Scheme | Marks | Comments |
|---|---|---|
| (i) \(\bar{x}=\dfrac{\Sigma fx}{\Sigma f}=\dfrac{21150}{61}\) | M1 | Correct method for \(\Sigma fx\), allow one slip. Allow embedded for M1. |
| \(=346.721\) Mean number of vaccines \(=346\,721\) | A1 | M1A1 for use of calculator Must be labelled as mean or \(\bar{x}\). Accept correctly rounded answers. -1 if ×1000 is omitted. Penalise once only. Allow 346.721 thousands. Allow 347(1000s). |
| \(\sigma=\sqrt{\dfrac{\Sigma fx^2}{\Sigma f}-\bar{x}^2}\) \(=\sqrt{\dfrac{8272500}{61}-\left(\dfrac{21150}{61}\right)^2}\) | M1 | FT their \(\bar{x}\) for M1 only |
| \(=124.093\) Standard deviation \(=124093\) | A1 | M1A1 for use of calculator Accept correctly rounded answers. -1 if ×1000 is omitted. Penalise once only. Allow 124.093 thousands. Allow 124.093(1000s). Accept calculation of \(s=\sqrt{\frac{1}{60}\left(8272500-\frac{21150^2}{61}\right)}=125.12289\) leading to 125123, which can earn M1A1 SC1 for sight of any of 15399.08627, \(1.5399\times 10^{10}\), 15655.7377, \(1.5656\times 10^{10}\) (in place of final two marks) M0 for sight of method for variance with no numerical answer. Alternative method: \(\sigma=\sqrt{\frac{\Sigma f(x-\bar{x})^2}{n}}=\sqrt{\frac{939344.2623}{61}}=124.093\) |
| (ii) Data is negatively skewed. | B1 | Accept left skew / skewed to the left. Ignore additional non-contradictory comments such as “but only very slightly”. NOTE: mean>median/mode is a contradictory comment. |
| [5] |
| Scheme | Marks | Comments |
|---|---|---|
Valid reason for the pattern, e.g.,
| E1 | E1 for comments about the weekly pattern. E0 for vaccines may have been done in batches. E0 for “Affected by number of vaccines available.” E0 for “Dips are where the last of the age are group getting the vaccine.” E0 for a comment relating to the overall increasing trend of the graph. |
| [1] |
| Scheme | Marks | Comments |
|---|---|---|
Valid reason, e.g.,
| E1 | Must comment on correctness. Need to see decision with a reason. Must have reason for saying anomaly / anomalous result – reason may include, for example, the data for these days does not fit with the rest of the data / other days were higher, etc. E1 for unable to tell if the data is correct just from the graph. E1 for a comment relating to supplies of the vaccine. Allow E1 for correct because they are government figures. Allow E1 for incorrect because they are government figures. |
| [1] | ||
| Total for Question | 8 |