
May 2026 Paper 1 Q6
6. A teacher records the marks scored by the pupils in her class for the prelim exam and the final exam.
The scattergraph shows the relationship between the marks scored in the prelim exam, \(P\), and the final exam, \(F\).
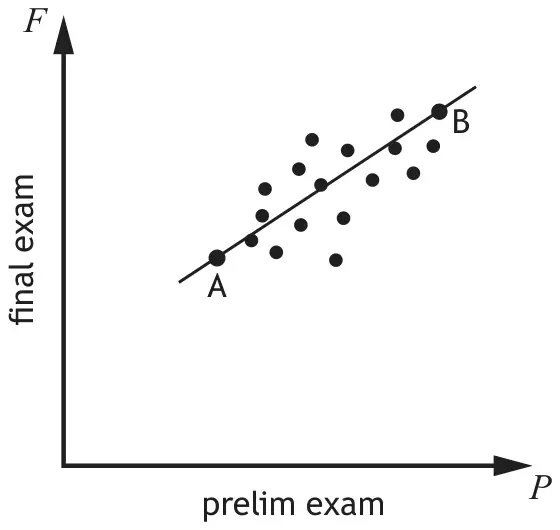
A line of best fit is drawn.
Point A represents a pupil who scored 30 in the prelim exam and 54 in the final exam.
Point B represents a pupil who scored 90 in the prelim exam and 94 in the final exam.
(a) Find the equation of the line of best fit in terms of \(F\) and \(P\).
Give the equation in its simplest form. [3]
Give the equation in its simplest form. [3]
A pupil scored 33 marks in the prelim exam.
(b) Use your equation from part (a) to estimate their mark in the final exam. [1]
| Mark | Generic scheme | Illustrative scheme |
|---|---|---|
| Method 1 | Method 1 | |
| •1 | calculate gradient | \(\dfrac{40}{60}\) or equivalent |
| •2 | substitute gradient and a point into \(y-b=m(x-a)\) | \(y-54=\dfrac{40}{60}(x-30)\) or \(y-94=\dfrac{40}{60}(x-90)\) |
| •3 | state equation in terms of \(F\) and \(P\) and in simplest form (remove any brackets and collect constants) | \(F=\dfrac{2}{3}P+34\) or \(3F=2P+102\) |
| Method 2 | Method 2 | |
| •1 | calculate gradient | \(\dfrac{40}{60}\) or equivalent |
| •2 | substitute gradient and a point into \(y=mx+c\) | \(54=\dfrac{40}{60}\times30+c\) or \(94=\dfrac{40}{60}\times90+c\) |
| •3 | state equation in terms of \(F\) and \(P\) and in simplest form | \(F=\dfrac{2}{3}P+34\) or \(3F=2P+102\) |
| (3) |
Notes:
- Correct answer without working. award 0/3
- For an incorrect simplification of a gradient, a mark is not awarded at the point where the simplification occurs eg
(a) \(\dfrac{40}{60}\left(=\dfrac{3}{2}\right)\to54=\dfrac{3}{2}\times30+c\to F=\dfrac{3}{2}P+9\). award 2/3 ✓✗✓1
(b) \(\dfrac{40}{60}\to54=\dfrac{40}{60}\times30+c\to F=\dfrac{3}{2}P+9\). award 2/3 ✓✓✗ - For subsequent incorrect working, •3 is not available.
- For •3 do not penalise a gradient which has been simplified to an integer.
Commonly Observed Responses:
- (a) \(\dfrac{60}{40}\to54=\dfrac{3}{2}\times30+c\to F=\dfrac{3}{2}P+9\) award 2/3 ✗✓1✓1
(b) \(\dfrac{60}{40}\to30=\dfrac{3}{2}\times54+c\to F=\dfrac{3}{2}P-51\) award 2/3 ✗✓1✓1 - (a) \(y-b=m(x+a)\to y-54=\dfrac{40}{60}(x+30)\to F=\dfrac{2}{3}P+74\) award 2/3 ✓✗✓1
(b) \(y-b=m(x+a)\to y-94=\dfrac{40}{60}(x+90)\to F=\dfrac{2}{3}P+154\) award 2/3 ✓✗✓1
| Mark | Generic scheme | Illustrative scheme |
|---|---|---|
| •4 | calculate mark | 56 |
| (1) |
Notes:
- Consistent answer without working. award 1/1
- •4 is available for using the candidate’s equation from part (a) with an integer gradient unless the gradient is \(\pm1\).
- Disregard use of % symbol.
Commonly Observed Responses:
- (a) \(F=\dfrac{3}{2}P-51\to-1.5\) award 1/1 ✓1
(b) \(F=\dfrac{3}{2}P-51\to-1.5\to1.5\) award 1/1 ✓1
(c) \(F=\dfrac{3}{2}P-51\to1.5\) award 0/1