
May 2024 Paper 1 Q9
9. In a car rally, competitors start at different times.
The scattergraph shows the relationship between the length of time they have been driving, \(T\) minutes, and the distance to the finishing line, \(D\) kilometres.
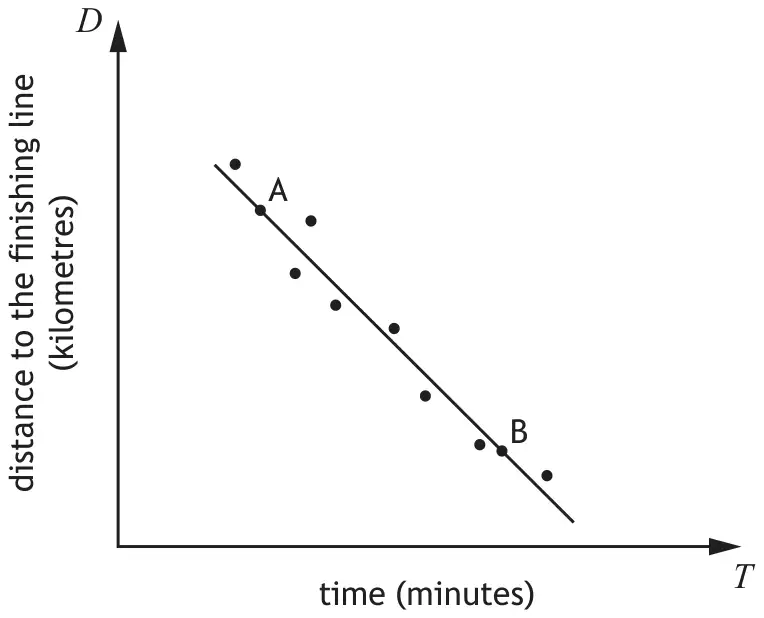
A line of best fit has been drawn.
Point A represents a competitor who has been driving for 3 minutes and is 26 kilometres from the finishing line.
Point B represents a competitor who has been driving for 10 minutes and is 12 kilometres from the finishing line.
(a) Find the equation of the line of best fit in terms of \(D\) and \(T\).
Give the equation in its simplest form. [3]
Give the equation in its simplest form. [3]
Another competitor has been driving for 7 minutes.
(b) Use your equation from part (a) to estimate the distance the competitor is from the finishing line. [1]
| Mark | Generic scheme | Illustrative scheme |
|---|---|---|
| Method 1 | Method 1 | |
| •1 | find gradient | \(-2\) |
| •2 | substitute gradient and a point into \(y-b=m(x-a)\) | \(y-26=-2(x-3)\) or \(y-12=-2(x-10)\) |
| •3 | state equation in terms of \(D\) and \(T\) in simplest form (remove brackets and collect constants) | \(D=-2T+32\) or equivalent |
| Method 2 | Method 2 | |
| •1 | find gradient | \(-2\) |
| •2 | substitute gradient and a point into \(y=mx+c\) | \(26=-2\times3+c\) or \(12=-2\times10+c\) |
| •3 | state equation in terms of \(D\) and \(T\) in simplest form (remove brackets and collect constants) | \(D=-2T+32\) or equivalent |
| (3) |
Notes:
- Correct answer without working award 0/3
- (a) For the award of •1 accept \(-\dfrac{14}{7}\). However see Note 3(a).
(b) BEWARE •1 is not available for \(\dfrac{26-12}{3-10}=\dfrac{-14}{7}=-2\) or \(\dfrac{12-26}{10-3}=\dfrac{14}{-7}=-2\) - For an incorrect simplification of a gradient, a mark is not awarded at the point where the error occurs eg
(a) \(-\dfrac{14}{7}=2\to26=2\times3+c\to D=2T+20\) award 2/3 ✗✓1✓1
(b) \(-\dfrac{14}{7}\to26=2\times3+c\to D=2T+20\) award 2/3 ✓✗✓1
(c) \(-\dfrac{14}{7}\to26=-\dfrac{14}{7}\times3+c\to D=2T+20\) award 2/3 ✓✓✗
Commonly Observed Responses:
Working must be shown
- \(y=-2x+32\) award 2/3 ✓✓✓2
- \(D=-\dfrac{2}{1}T+32\) award 2/3 ✓✓✓2
- \(-\dfrac{7}{14}\to y-26=-\dfrac{7}{14}(x-3)\to D=-\dfrac{1}{2}T+27.5\) award 2/3 ✗✓1✓1
- \(\dfrac{7}{14}\to y-26=\dfrac{7}{14}(x-3)\to D=\dfrac{1}{2}T+24.5\) award 2/3 ✗✓1✓1
| Mark | Generic scheme | Illustrative scheme |
|---|---|---|
| •4 | calculate distance remaining | 18 (km) |
| (1) |
Notes:
- Consistent answer without working award 1/1
- •4 is not available if the gradient is \(\pm1\).
Commonly Observed Responses:
No working necessary
- \(D=2T-8\) in part (a) leading to \(2\times7-8=6\) (km) award 1/1 ✓1
- (a) \(D=-2T-8\) in part (a) leading to \(-2\times7-8=-22\) (km) award 1/1 ✓1
(b) \(D=-2T-8\) in part (a) leading to \(-2\times7-8=-22\to22\) (km) award 1/1 ✓1
(c) \(D=-2T-8\) in part (a) leading to \(-2\times7-8=22\) (km) award 0/1 ✗