
May 2026 Paper 2 Q7
7. The diagram shows the curve with equation \(y=x^2-x-2\).
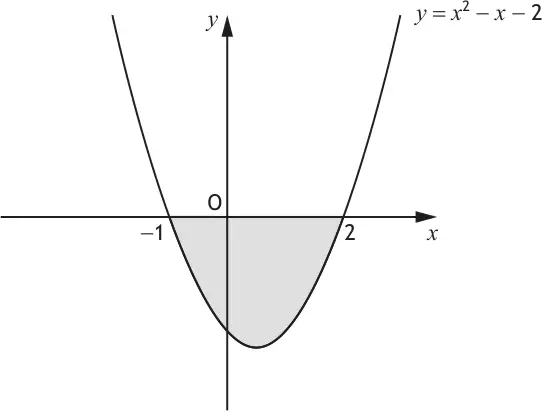
Calculate the shaded area. [4]
| Mark | Generic scheme | Illustrative scheme |
|---|---|---|
| Method 1 | Method 1 | |
| •1 | state integral which represents the area | eg \(-\displaystyle\int_{-1}^{2}\left(x^2-x-2\right)dx\) OR \(\displaystyle\int_{-1}^{2}\left(-x^2+x+2\right)dx\) |
| •2 | integrate valid expression | eg \(-\dfrac{x^3}{3}+\dfrac{x^2}{2}+2x\) |
| •3 | substitute limits | \(\left(-\dfrac{(2)^3}{3}+\dfrac{(2)^2}{2}+2(2)\right)-\left(-\dfrac{(-1)^3}{3}+\dfrac{(-1)^2}{2}+2(-1)\right)\) |
| •4 | evaluate area | \(\dfrac{9}{2}\left(\text{units}^2\right)\) |
| Method 2 | Method 2 | |
| •1 | state integral which is related to the area | eg \(\displaystyle\int_{-1}^{2}\left(x^2-x-2\right)dx\) |
| •2 | integrate valid expression | eg \(\dfrac{x^3}{3}-\dfrac{x^2}{2}-2x\) |
| •3 | substitute limits | \(\left(\dfrac{2^3}{3}-\dfrac{2^2}{2}-2(2)\right)-\left(\dfrac{(-1)^3}{3}-\dfrac{(-1)^2}{2}-2(-1)\right)\) |
| •4 | evaluate integral and state area | \(-\dfrac{9}{2}\ \therefore\) area \(=\dfrac{9}{2}\left(\text{units}^2\right)\) |
| (4) |
Notes:
- •1 is not available to candidates who omit ‘\(dx\)’.
- Limits must appear at the •1 stage for •1 to be awarded.
- In Method 1, accept \(\displaystyle\int_{-1}^{2}(0)-\left(x^2-x-2\right)dx\) OR \(\displaystyle\int_{2}^{-1}\left(x^2-x-2\right)dx\) for •1.
- Where candidates differentiate one or more terms at •2, then •3 and •4 are unavailable.
- Candidates who substitute limits without integrating do not gain •3 and •4.
- Do not penalise the inclusion of ‘\(+c\)’ at •2 and •3.
- Do not penalise the continued appearance of the integral sign or ‘\(dx\)’ after •1.
- In Method 2, where a candidate’s integral leads to a positive value, •4 is not available.
Commonly Observed Responses:
Candidate A - missing working
| \(-\displaystyle\int_{-1}^{2}\left(x^2-x-2\right)\) | •1 ^ |
| \(=-\dfrac{x^3}{3}+\dfrac{x^2}{2}+2x\) | •2 ✓ •3 ^ |
| \(=\dfrac{9}{2}\) | •4 ✓ |
Candidate B - evidence of substitution using a calculator
| •1 ^ | |
| \(=-\dfrac{x^3}{3}+\dfrac{x^2}{2}+2x\) | •2 ✓ |
| \(=\dfrac{10}{3}-\left(-\dfrac{7}{6}\right)\) | •3 ✓ |
| \(=\dfrac{9}{2}\) | •4 ✓ |
Candidate C - communication in Method 2
| \(\vdots\) \(=-\dfrac{9}{2}\) Hence area is \(\dfrac{9}{2}\) | •4 ✓ |
| \(=-\dfrac{9}{2}\) but area can’t be negative so \(\dfrac{9}{2}\left(\text{units}^2\right)\) | •4 ✓ |
| \(=-\dfrac{9}{2}\) so \(\dfrac{9}{2}\left(\text{units}^2\right)\) as it’s under the \(x\)-axis | •4 ✓ |
Candidate D - communication in Method 2
| \(\vdots\) \(=-\dfrac{9}{2}\) \(=\dfrac{9}{2}\left(\text{units}^2\right)\) | •4 ✗ |
| \(=-\dfrac{9}{2}\) but area can’t be negative \(=\dfrac{9}{2}\left(\text{units}^2\right)\) | •4 ✗ |
| \(=-\dfrac{9}{2}\) so \(\dfrac{9}{2}\left(\text{units}^2\right)\) | •4 ✗ |
Candidate E - limits not stated initially
| •1 ^ | |
| \(=-\dfrac{x^3}{3}+\dfrac{x^2}{2}+2x\) | •2 ✓ |
| \(=\left(-\dfrac{(2)^3}{3}+\dfrac{(2)^2}{2}+2(2)\right)\) \(\quad-\left(-\dfrac{(-1)^3}{3}+\dfrac{(-1)^2}{2}+2(-1)\right)\) | •3 ✓ |
| \(=\dfrac{9}{2}\) | •4 ✓ |
Corrected by Westie's Workshop
- The board's marking instructions printed “\(=-\dfrac{x^3}{3}+\dfrac{x^2}{2}-2x\)”. Changed to “\(=-\dfrac{x^3}{3}+\dfrac{x^2}{2}+2x\)” because in Candidate A: the integral of \(-x^2+x+2\) is \(-\dfrac{x^3}{3}+\dfrac{x^2}{2}+2x\) (as in the illustrative scheme), and only \(+2x\) gives the answer \(\dfrac{9}{2}\).
- The board's marking instructions printed “\(=-\dfrac{x^3}{3}+\dfrac{x^2}{2}-2x\)”. Changed to “\(=-\dfrac{x^3}{3}+\dfrac{x^2}{2}+2x\)” because in Candidate B: the integral of \(-x^2+x+2\) is \(-\dfrac{x^3}{3}+\dfrac{x^2}{2}+2x\) (as in the illustrative scheme), and only \(+2x\) gives the answer \(\dfrac{9}{2}\).
- The board's marking instructions printed “\(=-\dfrac{x^3}{3}+\dfrac{x^2}{2}-2x\)”. Changed to “\(=-\dfrac{x^3}{3}+\dfrac{x^2}{2}+2x\)” because in Candidate E: the integral of \(-x^2+x+2\) is \(-\dfrac{x^3}{3}+\dfrac{x^2}{2}+2x\) (as in the illustrative scheme), and only \(+2x\) gives the answer \(\dfrac{9}{2}\).
Original: see the board's marking instructions PDF (link above).