
May 2026 Paper 2 Q6
6. The diagram shows the graph of a cubic function \(y=f(x)\) with stationary points at \((-1,0)\) and \((1,-4)\).
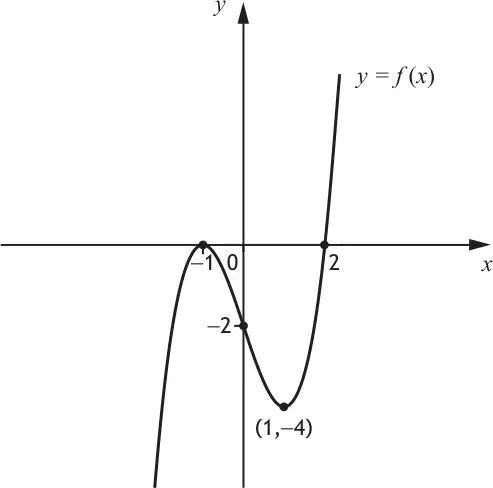
On the diagram in your answer booklet, sketch the graph of \(y=-f(x)+1\). [3]
| Mark | Generic scheme | Illustrative scheme |
|---|---|---|
| •1 | vertical reflection in \(x\)-axis identifiable from stationary points of graph | •1,2,3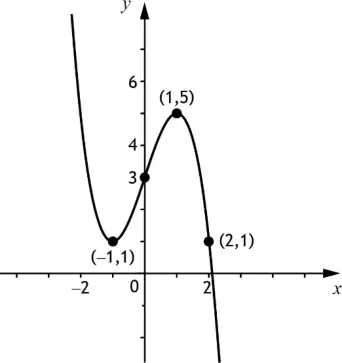 |
| •2 | vertical translation of ‘+1’ units identifiable from stationary points of graph | |
| •3 | transformation applied in the correct order and remaining points identifiable from graph | |
| (3) |
Notes:
- Where candidates do not sketch a cubic function of the correct orientation, award 0/3. However, see Candidate A.
- Where either stationary point has been incorrectly transformed, no marks are available. However, see Candidates A and B and the table for possible exceptions.
- Do not penalise graphs which cross the \(x\)-axis at (2,0) or which do not extend past (2,1).
Commonly Observed Responses:
Candidate A – one transformation
\(y=f(x)+1\)
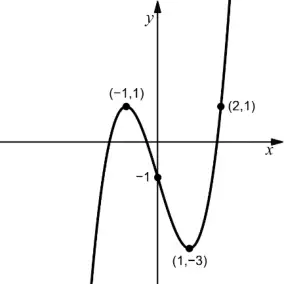
Award 1/3
Candidate B – one transformation
\(y=-f(x)\)
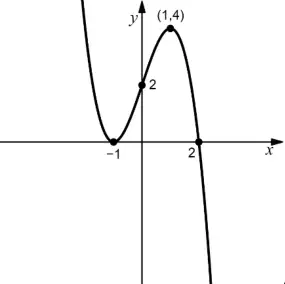
Award 1/3
Table showing two transformations…
| Function | Transformation of stationary points | Transformation of intercepts | Shape | Award |
|---|---|---|---|---|
| \(y=-f(x)-1\) | (−1,−1) and (1,3) | (2,−1) and (0,1) | 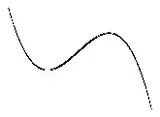 | 2/3 |
| \(y=f(-x)+1\) | (1,1) and (−1,−3) | (−2,1) and (0,−1) | | 1/3 |
| \(y=-f(x+1)\) | (−2,0) and (0,4) | (1,0) and (−1,2) | | 1/3 |
| \(y=-f(x-1)\) | (0,0) and (2,4) | (3,0) and (1,2) | | 1/3 |
| \(y=f((-x)+1)\) | (2,0) and (0,−4) | (−1,0) and (1,−2) | | 0/3 |
| \(y=f((-x)-1)\) | (0,0) and (−2,−4) | (−3,0) and (−1,−2) | | 0/3 |