
Foundation June 2022 Paper 3 Q24
24 1600 fish are released into a new lake which has no fish.
The number of fish is expected to increase by 5% each year.
Complete the table.
Round your answers to the nearest integer.
| Years after release | 0 | 1 | 2 | 3 | 4 |
|---|---|---|---|---|---|
| Expected number of fish | 1600 | 1680 | 1764 |
[3]
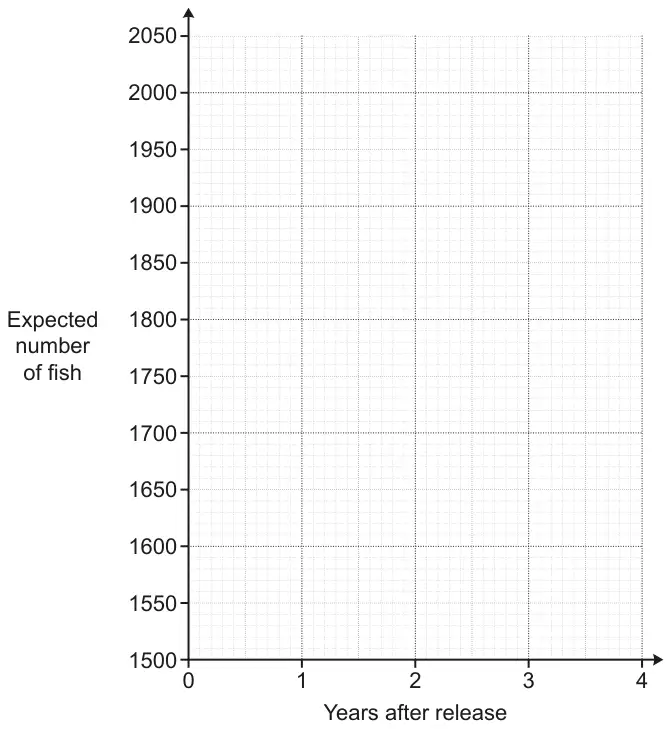
[3]
What effect would you expect this to have on the shape of your graph after 4 years? [2]
| Answer | Marks | Part marks and guidance | |
|---|---|---|---|
| 1852 1945 | 3 | B2 for 1852 or 1945 or 1852.2 with either 1944.[6] or 1944.8[1] or M1 for \(1764 \times \dfrac{5}{100} + 1764\) oe soi 1852.2 | e.g. \(1764 \times 1.05\) e.g. \(1600 \times 1.05^3\) NC% methods M1 for e.g. \(1764 \div 10 = [x]\). \([x] \div 2 = [y]\). \([y] + 1764\) |
Appendix
Non Calculator methods for percentages
Labels only
This is when labels such as 10% = are used.
If only labels are used the final answer scores full marks if it is correct.
Condone a numerical slip if the answer is correct.
If there is an error in the values and so the final answer is incorrect this cannot score method marks
e.g. Find 65% of 80
| Method scoring M1A1 | Method scoring M1A1 | Method scoring M0A0 |
|---|---|---|
| 10% = 8 5% = 4 50% = 40 65% = 52 ✓ M1A1 | 10% = 8 5% = 5 ✗ (condone this slip as answer correct) 50% = 40 65% = 52 ✓ M1A1 | 10% = 8 5% = 6 ✗ (do not condone this slip as answer incorrect) 50% = 40 65% = 54 ✗ M0 |
Build up method
This is where the candidate finds the percentages to build up to the required value but shows the operations used.
e.g. Find 65% of 80
\(10\% = 80 \div 10 = x\)
\(5\% = x \div 2 = y\)
\(50\% = x \times 5 = z\)
\(65\% = x + z + y\)
Because the operations have been shown and they are correct, if there is an error in one of \(x\), \(y\) or \(z\), method marks can still be earned
| Answer | Marks | Part marks and guidance | |
|---|---|---|---|
| Correct curved graph | 3 | B2 for 5 of their points plotted correctly or B1 for 4 of their points plotted correctly or 5 of their points plotted at correct height but incorrect time | ½ square accuracy Stick graph mark heights as points max B2 If stick graph and curve regard as choice and mark points/heights only Bar chart If points clearly marked, mark the points If points not clear B0 Ruled line or line segments max B2 |
| Answer | Marks | Part marks and guidance | |
|---|---|---|---|
| Increases [to 2000] Flattens/levels off/plateaus/horizontal [at 2000] | 1 1 | See Appendix 2000/the maximum must be seen once for 2 marks Accept approx/about 2000 Condone embellishments such as “slight fall” after correct statement or reference to line of best fit | |
Appendix
Exemplar responses for Question 24c
| Reason | Judgement | Mark |
|---|---|---|
| It would increase to 2000 then stay at 2000 | Correct correct | 1 1 |
| Once it reaches 2000 it will plateau | Reaches 2000 implies increasing It will plateau is fine | 1 1 |
| It would increase to approx. 2000 and then remain more or less constant around this value. | approx. is okay. 2000 referenced at least once. | 1 1 |
| Keep increasing as 2000 is a little way up the scale. | Increase is fine | 1 0 |
| It will increase and continue past the maximum Then it will fall as fish will die | Award for “It will increase” Doesn’t say the line will level off | 1 0 |
| After the 5th year the graph would be capped at 2000, only allowing 55 more fish in the lake. | Implies increase in graph BOD The description is for what is happening in the lake and not the shape of the graph | 1 0 |
| The line continues up and then falls | Continues up is enough but without the up, would not get the mark Falls is incorrect | 1 0 |
| It would cause it to slow down in the rate of increase and would then cause it to plateau. | Describes increase True. No mention of 2000. Max 1 mark | 1 0 |
| The line of best fit would hit a peak. | Not awarded as the peak could be at the end of the line so “up” not implied. | 0 1 |
| It would eventually plateau and level out with no increase. | No mention of increase (to 2000) | 0 1 |
| The line will continue to 2000 Then it will go along the x-axis | Correct as “the line continues” and max/2000 imply going up Incorrect as it is parallel to the x-axis, not along it | 1 0 |
| It starts to decrease…then not go past 2000 Once at 2000 it will stay around the same place | Incorrect should be increase Staying around the same place BOD for value | 0 1 |
| After 4 years the shape would no longer increase. It’ll stay at 2000 with a horizontal line on 2000. | Incorrect. Correct | 0 1 |
| It would plateau/level off at 2000 fish | No mention of graph increasing 2000 then staying there. | 0 1 |
| It would become a horizontal straight line | 0 1 | |
| The graph would plateau as no fish are being added or taken away | No mention of increase Correct for plateau | 0 1 |
| 4 years almost 2000 fish(1995) so the graph would plateau as no more fish can live in the pool | No increase Plateau | 0 1 |
| It would not increase. The line of best fit would level off and perhaps sometimes slightly decrease. | Wrong (but It would not increase past 2000 implies curve increasing for 1 mark) Level off okay, condone the rest as not contradicting | 0 1 |
| It will exceed the maximum amount of fish | Describing what is going on in the lake not the shape of the graph | 0 0 |
| Would start plateauing downward becoming more and more flat as less fish were present year by year. | No mention of increase (or 2000) Spoilt for second mark as suggests going down so is contradictory | 0 0 |
| The graph curves as the max capacity is exceeded | Ruled out as a possible interpretation is that it has already reached maximum and it then curves in some direction | 0 |