
October 2020 Paper 1 Q8
8 The histogram shows information about the lengths, \(l\) centimetres, of a sample of worms of a certain species.
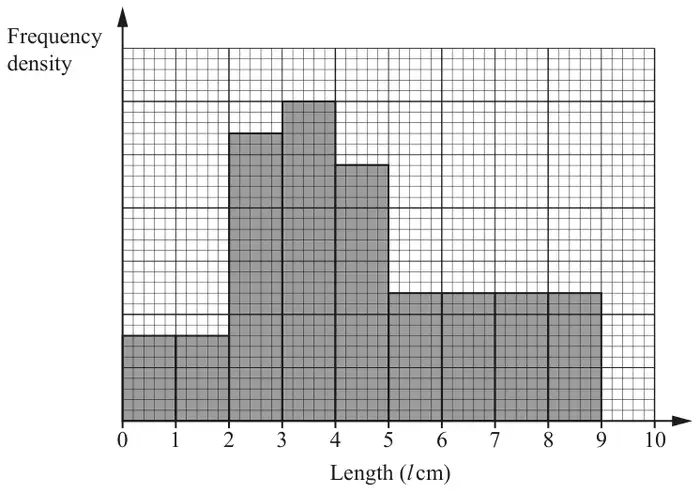
The number of worms in the sample with lengths in the class \(3 \leqslant l \lt 4\) is 30.
(a) Find the number of worms in the sample with lengths in the class \(0 \leqslant l \lt 2\). [2]
(b) Find an estimate of the number of worms in the sample with lengths in the range \(4.5 \leqslant l \lt 5.5\). [3]
| Scheme | Marks | AO |
|---|---|---|
| \(30 \times 2 \times 1.6/6\) or \(30 \times 2 \times 8/30\) oe | M1 | 1.1 |
| \(= 16\) | A1 | 1.1 |
| [2] |
Notes
M1: or \(15 \times 80/150\) oe
A1: Correct answer without working or unclear working: allow M1A1
| Scheme | Marks | AO |
|---|---|---|
| Freq 4-5 = 24 or freq 5-6 = 12 | B1 | 3.1a |
| \(\frac{1}{2}\)(freq 4-5 + freq 5-6) or \(\frac{1}{2} \times 24 + \frac{1}{2} \times 12\) | M1 | 1.1 |
| \(= 18\) | A1 | 1.1 |
| [3] |
Notes
B1: or freq 5-9 = 48 OR similar with frequency density
M1: or \(\frac{1}{2}\)(freq 4-5) + \(\frac{1}{8}\)(freq 5-9) oe
A1: Correct answer without working or unclear working: allow B1M1A1