
June 2018 Paper 1 Q13
13 The radar diagrams illustrate some population figures from the 2011 census results.
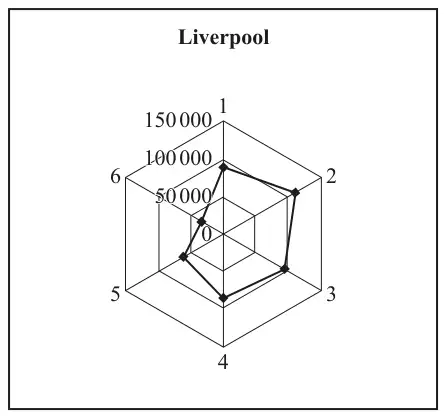
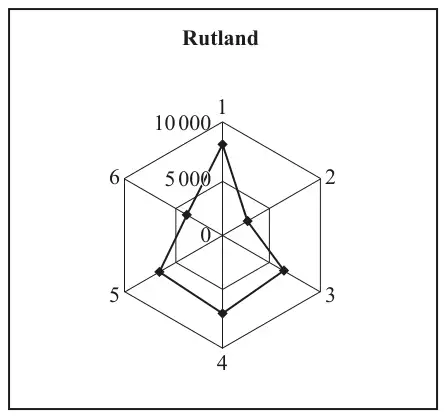
Each radius represents an age group, as follows:
| Radius | 1 | 2 | 3 | 4 | 5 | 6 |
| Age group | 0–17 | 18–29 | 30–44 | 45–59 | 60–74 | 75+ |
The distance of each dot from the centre represents the number of people in the relevant age group.
“Assuming that there are no significant movements of population either into or out of the two regions, the 2021 census results are likely to show an increase in the number of children in Liverpool and a decrease in the number of children in Rutland.”
Use the radar diagrams to give a justification for this claim. [2]
| Scheme | Marks | AO |
|---|---|---|
| Advantage: Type 1 answers: State or imply compare proportions (or distributions or structure or profile or pattern) Examples: Can comp proportions (or distributions or structure or profile) Allow can see props Can compare areas' age groups relative to size of area Easier to see age groupp distributions | E1 | 1.1 |
| Disadvantage: Type 1 answers: State or imply pop sizes not easy to compare Examples: Diag does not show relative sizes of the authorities R'd appears to have more in 0-17, but actually L'l has more in this group Hard to compare because diff nos rep by same size on diags Can't compare numbers (or results or pops or sizes) easily Can't compare numbers (or results or pops or sizes) without calculation | E1 | 1.1 |
| [2] |
Notes
In all parts, once mark gained, ignore all else. Allow eg "Group 1" for 0-17s etc. Allow "children" for 0-17s
Advantage: Type 2 answers:
State or imply with same scale, sizes of diags wd be very different
Examples:
Prevents diag from becoming too big or too small to use effectively
If one set of values is a lot lower than the other, it will be hard to compare them on the same scale.
NOT e.g:
Easy to compare large area with small
Easier to see results
Easy to compare populations
Because L is bigger than R
Can compare age in small & large areas
Disadvantage: Type 2 answers:
State or imply mismatch between diag size and pop size
Examples:
Confusing because same size diag for diff size populations
Looks as if same no. of people in each
Might miss the fact that scales are diff, looks as if more 0-17s in R'd than L'l
NOT eg
Can't compare results
Can't compare numbers
Easy to be mistaken when comparing
| Scheme | Marks | AO |
|---|---|---|
| 90000. Allow between 75000 & 95000 incl. | B1 | 2.2b |
| [1] |
Notes
Allow reasonable ans given as range eg "Much more than 50000 but < 100000"
In all parts, once mark gained, ignore all else. Allow eg "Group 1" for 0-17s etc. Allow "children" for 0-17s
| Scheme | Marks | AO |
|---|---|---|
| "L" = Liverpool. "R" = Rutland NB: Must be about 60-74s and/or 18-29s and/or 0-17s Answer type 1 Compare proportions in two age groups. Examples: Any two of eg: L has smaller prop of 60-74 (than R'd) L has smaller prop of 0-17s (than R'd) L has larger prop of 18-29s (than R) eg, L prop of 18-29s is 4 × R prop 18-29s R has smaller prop of 18-29s R has hier prop of 0-17s | E1 E1 | 2.2b 2.2b |
| [2] |
Notes
Answer type 2
Compare gps with largest (or smallest) props. Allow "number" instead of prop only for this type of answer
Examples:
L's hiest no. (or mode) is 18-29s AND R's hiest no. (or mode) is 0-17s E1 only
L'ls smallest is 75+ AND R's smallest is 18-29 E1 only
(75+ allowed in this case only)
NOT "number" except in ans about modes or smallest.
Ignore all else.
Answer type 3
Comp props in same age gps
Examples:
L has high prop 18-29s AND R has low prop 18-29s E1 only
R has high prop 60-74s AND L has low prop 60-74s E1 only
NOT eg L has more 18-29s than R
In all parts, once mark gained, ignore all else. Allow eg "Group 1" for 0-17s etc. Allow "children" for 0-17s
| Scheme | Marks | AO |
|---|---|---|
| Must state gp who are likely to have babies ie 18-29s or 30-44s or 18-44s. (Allow 0-29s or "young") | E1 ind | 2.4 |
| This gp is large in L, AND is small in R | E1dep | 2.4 |
| [2] |
Notes
Inadequate ans:
L high prop of young, who will have babies E1
R high prop of old E0
Allow "number" instead of "proportion"
NOT just This gp is larger in L
In all parts, once mark gained, ignore all else. Allow eg "Group 1" for 0-17s etc. Allow "children" for 0-17s