
October 2020 Paper 2 Q14
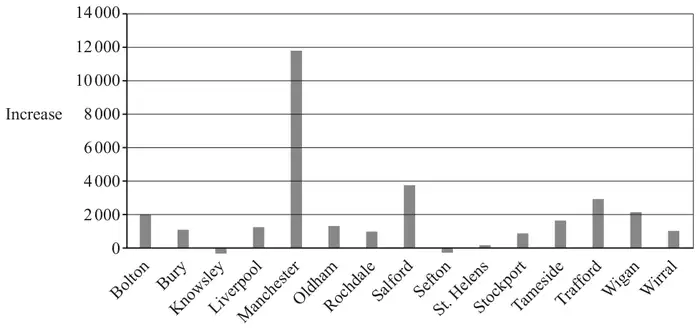
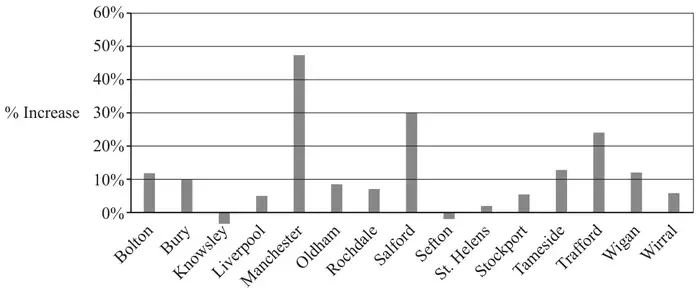
14 Table 1 shows the numbers of usual residents in the age range 0 to 4 in 15 Local Authorities (LAs) in 2001 and 2011. The table also shows the increase in the numbers in this age group, and the same increase as a percentage.
| 2001 | 2011 | Increase | % Increase | |
|---|---|---|---|---|
| Bolton | 16 779 | 18 765 | 1 986 | 11.84% |
| Bury | 11 117 | 12 235 | 1 118 | 10.06% |
| Knowsley | 9 454 | 9 121 | −333 | −3.52% |
| Liverpool | 24 840 | 26 099 | 1 259 | 5.07% |
| Manchester | 24 693 | 36 413 | 11 720 | 47.46% |
| Oldham | 15 196 | 16 491 | 1 295 | 8.52% |
| Rochdale | 13 771 | 14 754 | 983 | 7.14% |
| Salford | 12 529 | 16 255 | 3 726 | 29.74% |
| Sefton | 14 896 | 14 601 | −295 | −1.98% |
| St. Helens | 10 083 | 10 269 | 186 | 1.84% |
| Stockport | 16 457 | 17 342 | 885 | 5.38% |
| Tameside | 12 803 | 14 439 | 1 636 | 12.78% |
| Trafford | 11 971 | 14 870 | 2 899 | 24.22% |
| Wigan | 17 561 | 19 681 | 2 120 | 12.07% |
| Wirral | 17 475 | 18 514 | 1 039 | 5.95% |
Table 1
Fig. 2 shows the increase in each LA in raw numbers, and Fig. 3 shows the percentage increase in each LA.
Give a reason for your answer. [2]
Suggest, using only data from Fig. 2 and Fig. 3 and/or Table 1, which two LAs these are most likely to be. [2]
| Scheme | Marks | AO |
|---|---|---|
| (i) The actual number of extra pupils determines the number of places needed Shows how many new students there will be Shows trend so LA can provide accordingly Need to know expected number of pupils | B1 | 2.2b |
| [1] | ||
| (ii) Wigan Increase in number is greatest there | B1 B1 | 2.2b 2.2b |
| [2] | ||
| (iii) E.g. all those in this category stay in the LA Populations continue growing at same rate Populations all growing at same rate The population increases consistently NOT Increase has been steady All LAs have the same teacher/pupil ratio All LAs have same need for teachers in 2011 | B1 | 2.2b |
| [1] |
Notes
(a)(i) The existing numbers are already catered for
Increase in provision
Not Need to know increase in proportion of pupils
(a)(ii) Allow “Wigan and Bolton”
Ignore mention of % increase. Ignore extras.
(a)(iii) No decrease in population
Children born in that LA will go to school in that LA
Assume no great influx or outflow of children after 2011.
The LAs are not currently understaffed
Ignore extra eg “between 2001 & 2011”
| Scheme | Marks | AO |
|---|---|---|
| Manchester and Salford B1 Highest % or absolute increase B1dep Manchester and Liverpool B1 The two highest in 2011 B1dep SC Manchester (alone), Highest % or absolute increase: B1B0 | B1 B1 | 2.2b 2.4 |
| [2] |
Notes
Wigan and Bolton B1
Highest numbers in 2011 except Manchester and Liverpool, which are very large B1dep
Salford and Trafford B1
They have the largest absolute (or %) increase, but are small (or not huge like Manchester) B1dep