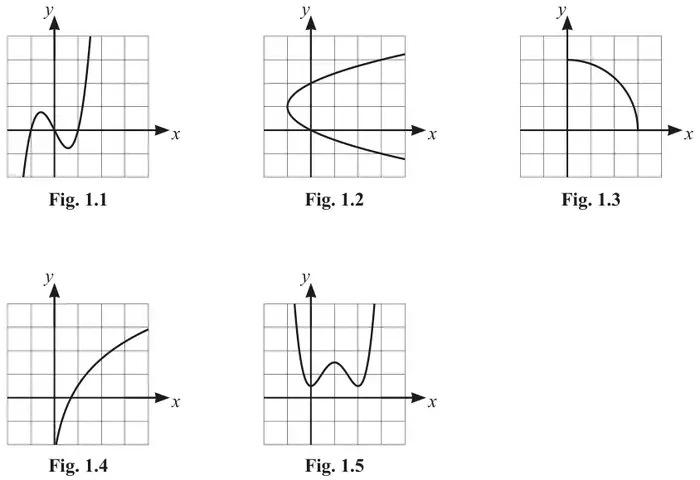
(a) The diagrams show five different graphs. In each case the whole of the graph is shown. Place ticks in the boxes in the table in the Printed Answer Booklet to indicate, for each graph, whether it represents a one-one function, a many-one function, a function that is its own inverse or it does not represent a function. There may be more than one tick in some rows or columns of the table. [4]
One-one
Many-one
Own inverse
Not a function
Fig. 1.1
Fig. 1.2
Fig. 1.3
Fig. 1.4
Fig. 1.5
(b) A function f is defined by \(\mathrm{f}(x) = \dfrac{1}{x}\) for the domain \(\{x : 0 \lt x \leqslant 2\}\). State the range of f, giving your answer in set notation. [2]
Mark scheme (a)
Scheme
Marks
AO
One-one
Many-one
Own inverse
Not a function
1
✓
2
✓
3
✓
✓
4
✓
5
✓
B4
1.2 1.2 1.1 2.2a
[4]
Notes
B4 for all 5 rows correct B3 for 3 or 4 rows correct B2 for 2 rows correct B1 for 1 row correct
Mark scheme (b)
Scheme
Marks
AO
\(\geqslant \frac{1}{2}\)
B1
1.2
\(\{y : y \geqslant \frac{1}{2}\}\), \(\{y : \frac{1}{2} \leqslant y \lt \infty\}\), \(\{y : \frac{1}{2} \leqslant y \leqslant \infty\}\) or \([\frac{1}{2}, \infty)\) or \([\frac{1}{2}, \infty]\)
B1
2.5
[2]
Notes
B1: \(\geqslant \frac{1}{2}\) soi, no top limit (except \(\infty\)). Allow \(\gt \frac{1}{2}\) Allow \(\mathrm{f}(x)\) or \(\dfrac{1}{x}\) or any letter or none for 1stB1
B1: Correct range in set notation. Any letter (not \(x\)) or \(\dfrac{1}{x}\) or \(\mathrm{f}(x)\)