
October 2021 Paper 2 Q9
9 Arun, Beth and Charlie are investigating whether there is any association between death rate per 1000 and physician density per 1000. They each collect a random sample of size 10.
Arun’s sample is shown in Fig. 9.1.
| death rate per 1000 | physician density per 1000 | |
|---|---|---|
| Canberra | 7.2 | 3.62 |
| Dhaka | 5.3 | 0.49 |
| Brasilia | 6.8 | 2.23 |
| Yaounde | 9.3 | 0.08 |
| Zagreb | 12.5 | 3.08 |
| Tehran | 5.4 | 1.16 |
| Rome | 10.7 | 4.14 |
| Tripoli | 3.8 | 2.09 |
| Oslo | 7.9 | 4.51 |
| Abuja | 9.7 | 0.35 |
Fig. 9.1
Beth and Charlie collected their samples from the pre-release material. Each of them drew a scatter diagram for their samples. The samples and scatter diagrams are shown in Figs. 9.2 and 9.3.
| Beth’s sample | death rate per 1000 | physician density per 1000 |
|---|---|---|
| Sudan | 6.7 | 0.41 |
| Cambodia | 7.4 | 0.17 |
| Gabon | 6.2 | 0.36 |
| Seychelles | 7 | 0.95 |
| Mexico | 5.4 | 2.25 |
| Kuwait | 2.3 | 2.58 |
| Haiti | 7.5 | 0.23 |
| Maldives | 4 | 1.04 |
| Nauru | 5.9 | 1.24 |
| Jordan | 3.4 | 2.34 |
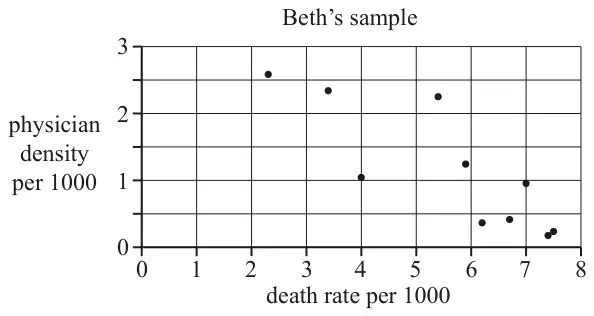
Fig. 9.2
| Charlie’s sample | death rate per 1000 | physician density per 1000 |
|---|---|---|
| Vanuata | 4 | 0.17 |
| Solomon Islands | 3.8 | 0.2 |
| N. Mariana Islands | 4.9 | 0.36 |
| Nauru | 5.9 | 1.24 |
| United Kingdom | 9.4 | 2.81 |
| Portugal | 10.6 | 3.34 |
| North Macedonia | 9.6 | 2.87 |
| Faroe Islands | 8.8 | 2.62 |
| Bulgaria | 14.5 | 3.99 |
| St. Kitts and Nevis | 7.2 | 2.52 |
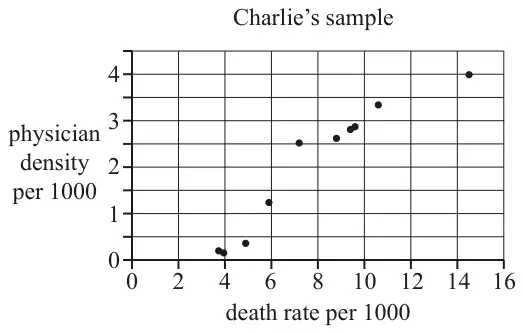
Fig. 9.3
Arun states that Charlie’s sample and Beth’s sample cannot both be random for the following reasons.
- Both samples include Nauru – there should not be any common values.
- Beth’s diagram suggests a negative association between death rate and physician density, whereas Charlie’s diagram suggests a positive association. If both samples are random the same relationship would be suggested.
- Explain whether Arun’s reasons are valid.
- State whether or not Arun is correct, or whether it is not possible to say. [3]
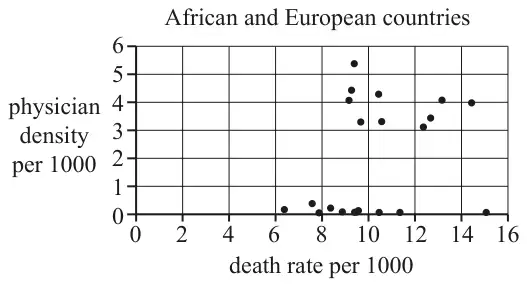
Kofi collects a sample of 10 African countries and 10 European countries. The scatter diagram for his results is shown in Fig. 9.4.
| Scheme | Marks |
|---|---|
| The sample is not from the pre-release material because Arun has data from capital cities. The pre-release material only has data for countries | B1 |
| [1] |
Notes
LDS advantage
| Scheme | Marks |
|---|---|
| It is possible for the same value to be selected in two different random samples. | B1 |
| Different samples (especially when small) might lead to different conclusions being made. | B1 |
| So there is no evidence to suggest Arun’s statement is correct | B1 |
| [3] |
| Scheme | Marks |
|---|---|
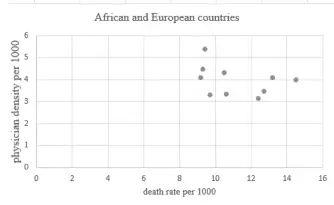 Many African countries have a lower physician density (and often have a high death rate) | B1 |
| [1] |
Notes
B1: OR European countries generally have a higher physician density (and often have a low death rate)
LDS advantage