
June 2025 Paper 2 Q14
14 An environmental scientist is monitoring the fish population in a river. One day he catches some fish from a certain pool on the river. He weighs each fish before returning them all unharmed to the river.
The results are displayed in the histogram.
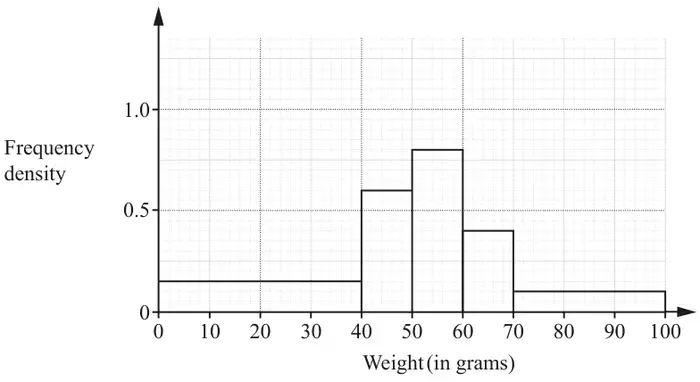
(a) Use the information in the histogram to determine an estimate of the percentage of fish in the river that weigh at least 40 grams. [3]
(b) Identify a limitation of your answer to part (a). [1]
| Scheme | Marks | AO |
|---|---|---|
| \(\dfrac{10 \times 0.6 + 10 \times 0.8 + 10 \times 0.4 + 30 \times 0.1}{40 \times 0.15 + 10 \times 0.6 + 10 \times 0.8 + 10 \times 0.4 + 30 \times 0.1}\) oe | M1 M1 | 3.1b 1.1 |
| \(\left[\frac{21}{27} = \frac{7}{9}\right] \times 100 = 77.8\%\) | A1 | 1.1 |
| [3] |
Notes
M1: Numerator allow maximum of 1 error
M1: denominator allow maximum of 1 error
A1: awrt 78%
| Scheme | Marks | AO |
|---|---|---|
| eg just one pool/day is sampled and fish in this pool/day may not be typical of fish in all the river | B1 | 3.2b |
| [1] |
Notes
Value from small sample may be biased.