
June 2018 Paper 2 Q10
10 The screenshot in Fig. 10 shows the probability distribution for the continuous random variable \(X\), where \(X \sim \mathrm{N}\left(\mu, \sigma^2\right)\).
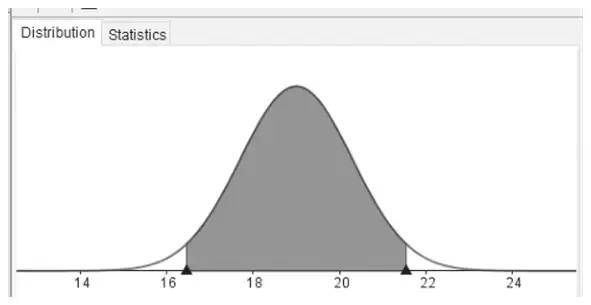
The area of each of the unshaded regions under the curve is 0.025. The lower boundary of the shaded region is at 16.452 and the upper boundary of the shaded region is at 21.548.
(i) Calculate the value of \(\mu\). [1]
(ii) Calculate the value of \(\sigma^2\). [3]
(iii) \(Y\) is the random variable given by \(Y = 4X + 5\).
(A) Write down the distribution of \(Y\). [3]
(B) Find \(\mathrm{P}(Y > 90)\). [1]
| Scheme | Marks | AO |
|---|---|---|
| \([\mu =]\, 19\) | B1 | 1.1 |
| [1] |
| Scheme | Marks | AO |
|---|---|---|
| \(1.96 = \dfrac{21.548 - 19}{\sigma}\) | M1 | 3.1a |
| \([\sigma =]\) awrt 1.3 | A1 | 1.1 |
| \(\left[\sigma^2 =\right]\) awrt 1.69 | A1 | 1.1 |
| [3] |
Notes
M1: or \(-1.96 = \dfrac{16.452 - 19}{\sigma}\)
NB 1.959963985…rounded to 3 or more sf
M0 if \(z = 2\)
A1: may be implied by final answer
A1: allow B3 for awrt 1.69 unsupported
| Scheme | Marks | AO |
|---|---|---|
| (A) \([\mu =]\ 4 \times\) their \(19 + 5\) | M1 | 2.1 |
| \(\left[\sigma^2 =\right]\ 4^2 \times\) their 1.69 or \(\sigma = 4 \times\) their 1.3 | M1 | 1.1 |
| \([Y \sim]\ \mathrm{N}\left(81, 5.2^2\right)\) oe | A1 | 1.1 |
| [3] | ||
| (B) 0.04175 or 0.0417 or 0.042 BC | B1 | 1.1 |
| [1] |
Notes
(A)
A1: NB 27.04
(B)
B1: NB 0.0417462427103