10. 280 students took tests in each of the three subjects, Biology, Chemistry and Physics. Each test consisted of questions worth a total of 40 marks.
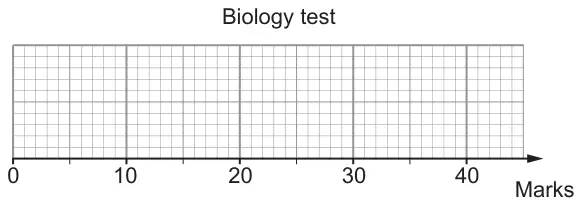
(a) The following table shows a summary of the Biology test data.
Lowest mark
Highest mark
Lower quartile
Median
Interquartile range
12
40
22
29
13
On the grid below, draw a box plot to represent this data. [3]
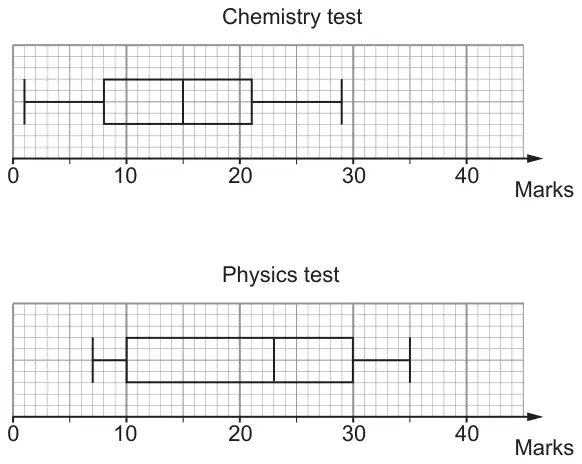
(b) Two box plots have been drawn representing the test data for Chemistry and Physics.
(i) Calculate the number of students that were awarded 10 or more marks in Physics. [2]
(ii) Two teachers disagree over the spread of the marks.
One teacher states that the spread of marks is the same for all three tests. The other teacher states that the spread of the marks is the same in only two of the tests.
Explain why both teachers are correct. You must give values to justify your answer. [3]
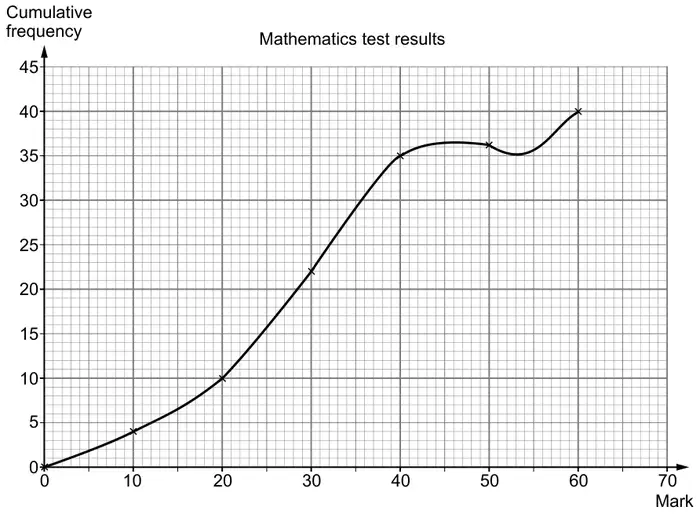
(c) A different set of students sat a mathematics test. The test was out of 60 marks. The results obtained were recorded in a table and a cumulative frequency graph was drawn.
Mark (\(m\))
Cumulative Frequency
\(0 \lt m \leqslant 10\)
4
\(0 \lt m \leqslant 20\)
10
\(0 \lt m \leqslant 30\)
22
\(0 \lt m \leqslant 40\)
35
\(0 \lt m \leqslant 50\)
36
\(0 \lt m \leqslant 60\)
40
Criticise the above graph. [1]
Mark scheme (a)
Scheme
Marks
Comments
Upper quartile = 35
B1
Seen or implied
Left whisker at 12 and right at 40
B1
LQ 22, median 29 and UQ 35
B1
Must be seen in a correct box plot, FT their UQ; if no UQ is stated and it is not at 35 allow this mark provided 29 < UQ < 40
Mark scheme (b)
Scheme
Marks
Comments
(b)(i) 210 (students)
B2
B1 for 280 ÷ 4 × 3 or 0.75 × 280 or appropriate sight of 75%
(b)(ii) Explanation, using both range and IQR with correct values, e.g. All three ranges are 28 AND two IQ ranges are 13, and the other is 20
B3
May be seen by the diagrams.
Allow B3 for all three ranges are 28 AND only two of the IQR’s are 13 provided no incorrect value given for the 20.
Award B2 for one of the following:
An answer that would be awarded B3 but the 20 is incorrect.
a correct explanation with errors or omissions in the values given e.g. All three ranges are 27 AND only two IQ ranges are the same.
a correct explanation with no values given e.g. All three ranges are the same AND only two IQ ranges are the same.
Award B1 for either:
All three ranges are 28
the IQ ranges are 13, 20 and 13
Mark scheme (c)
Scheme
Marks
Comments
Reference to graph indicating that it shouldn’t decrease.
We'd like to use Google Analytics cookies to count visits and see which pages help most. They're optional, and the site works exactly the same either way. Privacy policy