8. The table shows some of the values of \(h = -3(t + 1)(t - 4)\) for \(0 \leqslant t \leqslant 5\).
\(t\)
0
1
2
3
4
5
\(h = -3(t + 1)(t - 4)\)
18
18
0
(a) Complete the table above. [2]
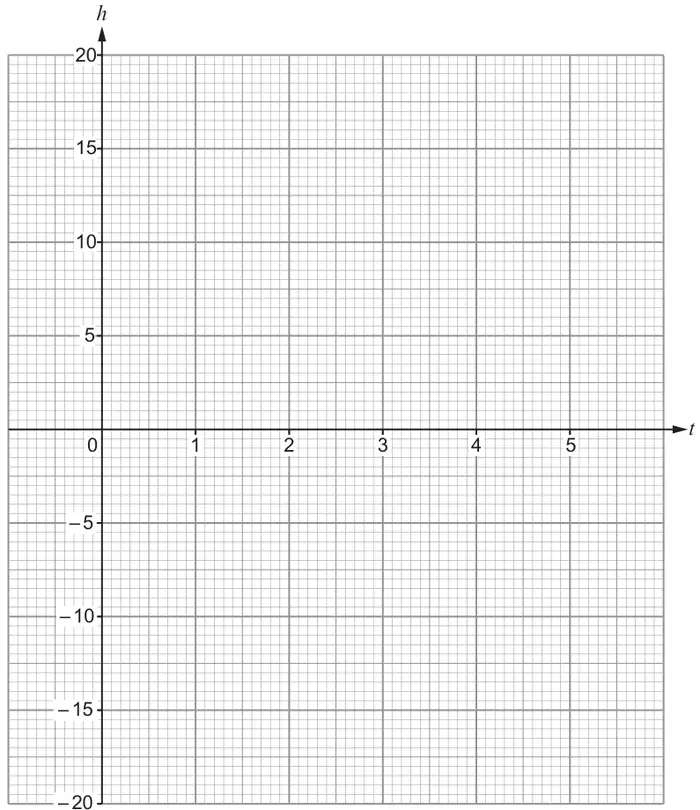
(b) On the graph paper below, draw the graph of \(h = -3(t + 1)(t - 4)\) for \(0 \leqslant t \leqslant 5\). [2]
(c)
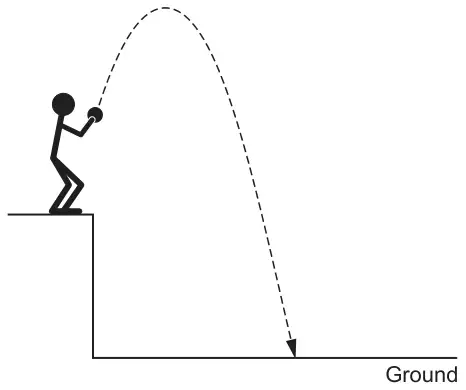
Diagram not drawn to scale
Derek throws a ball upwards from a point above horizontal ground. The height, \(h\) metres, of the ball above the ground \(t\) seconds after Derek throws it is \(h = -3(t + 1)(t - 4)\).
(i) What is the height of the ball above the ground at the start of Derek’s throw? [1]
(ii) How many seconds after Derek throws the ball does it first hit the ground? [1]
(iii) How many seconds after Derek throws the ball is it at its maximum height? [1]
(iv) What is the maximum height of the ball above the ground? [1]
Mark scheme (a)
Scheme
Marks
Comments
\(t\)
0
1
2
3
4
5
\(h\)
12
18
18
12
0
\(-18\)
B2
B1 for any two correct
Mark scheme (b)
Scheme
Marks
Comments
All 6 correct points plotted correctly and joined with a smooth curve
B2
Mark intent
B1 for a smooth curve at least through 4 correct pairs of coordinates or for all of their 6 pairs of coordinates plotted correctly
Allow 2 marks here if curve correct even if there is a slip in their table
We'd like to use Google Analytics cookies to count visits and see which pages help most. They're optional, and the site works exactly the same either way. Privacy policy