
Higher November 2022 Paper 2 Q22
22. The diagram shows the velocity, \(v\) metres per second, of a particle \(t\) seconds after it passes a fixed point.
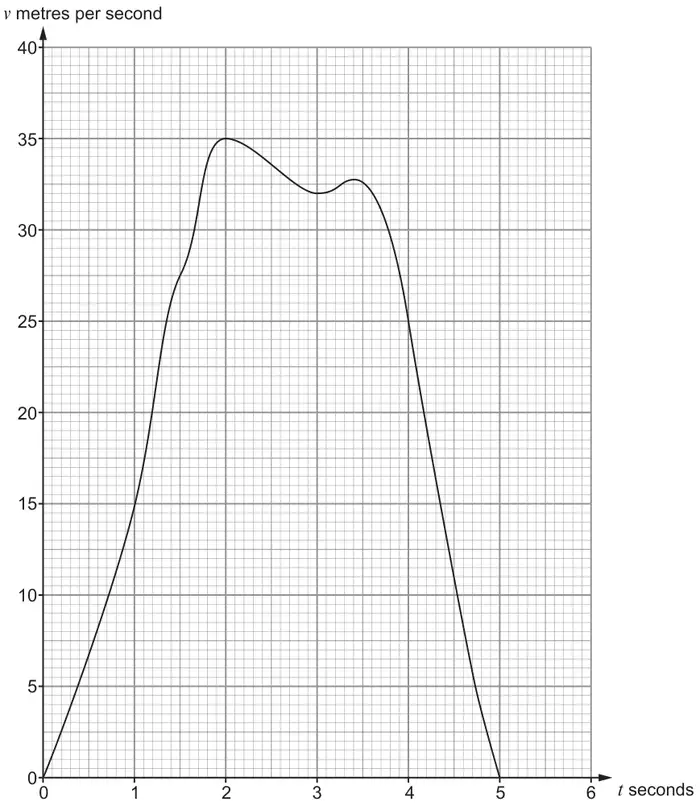
(a) Calculate an estimate of the acceleration of the particle when \(t\) = 3·5 seconds. [3]
(b) Use five vertical strips of equal width to estimate the distance travelled by the particle in the first 5 seconds after it passes the fixed point. [4]
| Scheme | Marks | Comments |
|---|---|---|
| Reasonable tangent drawn at \(t\) = 3.5 | S1 | |
| Calculates \(\dfrac{\text{vertical diff}}{\text{horizontal diff}}\) | M1 | FT ‘their tangent’ provided S1 awarded |
| Correct gradient | A1 | FT ‘their \(\dfrac{\text{vertical diff}}{\text{horizontal diff}}\)’; must be negative |
| Scheme | Marks | Comments |
|---|---|---|
| Correct calculation for the area using 3 trapezia and 2 triangles oe e.g. \(\tfrac{1}{2}\times(1)\times 15 + \tfrac{1}{2}\times(1)\times(15 + 35) + \tfrac{1}{2}\times(1)\times(35 + 32)\) \(+\,\tfrac{1}{2}\times(1)\times(32 + 25) + \tfrac{1}{2}\times(1)\times 25\) | M3 | Allow 14 to 15 and 24 to 25 for \(v\) at \(t\) =1 and \(t\)=4 M2 for a correct calculation with one error (possibly repeated) in a \(v\) value or M1 for a sum of 5 areas using strips of equal width with at most 2 errors |
| 107 (metres) | A1 | FT Accept answer in range 105 to 109 inclusive with working; ignore any units if stated |
| (7) |