
Higher November 2021 Paper 1 Q7
7. Novak’s online chocolate company has a special offer.
Special Offer
Free sample box worth £3*
*requires a minimum spend of £25
Novak records the number of free sample boxes he sends to his customers.
The graph shows the relative frequency that a customer has been sent a free sample box after 200, 400, 600, 800 and 1000 customer orders.
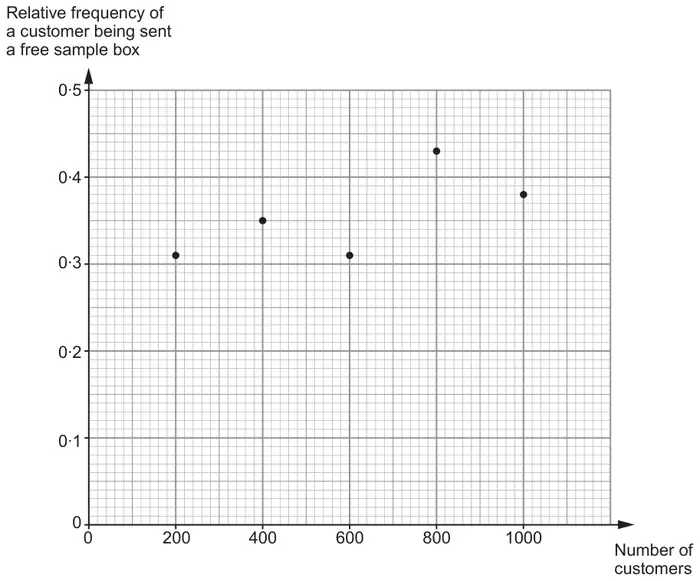
(a) What is the total value of the free sample boxes that Novak sent his first 400 customers? [4]
Total value of free sample boxes is £ …………………………
Total value of free sample boxes is £ …………………………
(b) Novak says:
“The most accurate estimate of the probability that a customer will be sent a free sample box is 0·38.”
Is he correct?Yes ☐ No ☐
Explain how you decide. [1]| Scheme | Marks | Comments |
|---|---|---|
| 0.35 identified as the appropriate relative frequency for 400 customers | B1 | and no other relative frequency |
| \(0.35 \times 400 \times 3\) or \(140 \times 3\) si | M2 | FT ‘their 0.35’, provided it is 0.31, 0.43 or 0.38 or 0.34 or 0.36 for M2 or M1; no FT if e.g. a sum of relative frequencies has been used M1 for \(0.35 \times 400\) si; not just for e.g. ‘0.35 of 400’ |
| (£)420(.00) | A1 | CAO |
| Scheme | Marks | Comments |
|---|---|---|
| Yes and valid explanation involving (1000 being) the largest number of customers e.g. ‘It is the relative frequency from the largest sample.’ | E1 | Do not allow ‘Out of 1000 customers 0.38 were sent a free box.’ or ‘Yes as the average relative frequency to customer ratio is higher’ |
| (5) |