
Higher November 2019 Paper 1 Q23
23.
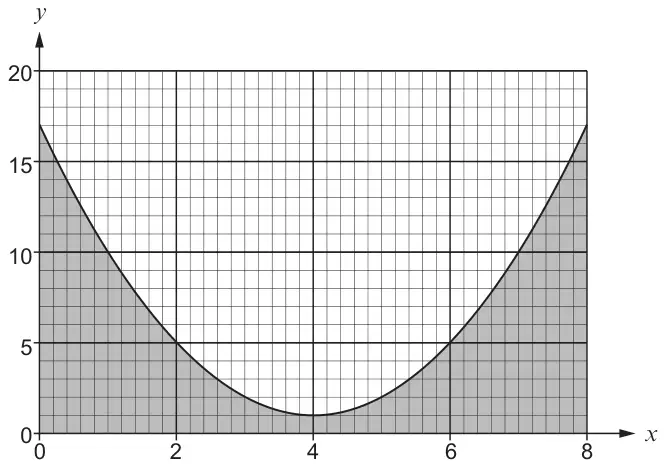
The diagram shows the graph of \(y = (x - 4)^2 + 1\) for \(0 \leqslant x \leqslant 8\).
(a) Using four vertical strips of equal width, estimate the area of the shaded region. [4]
(b) Is your answer to part (a) an underestimate or an overestimate?
Underestimate ☐ Overestimate ☐
Explain how you decide. [1]| Scheme | Marks | Comments |
|---|---|---|
| Summation of areas of 4 vertical strips | S1 | e.g. trapezium rule or equivalent attempted with trapezia or triangles and rectangles Do not allow for ‘counting squares and adding’, even if by strip |
| (\(y\) values = ) 17, 5, 1, [5, 17] si | B1 | ignore extra correct \(y\) values for this mark; |
| Correct calculation for the area using 4 trapezia oe | M1 | FT ‘their \(y\)-values’ e.g. \(2\left(\dfrac{1}{2} \times 2 \times (17 + 5) + \dfrac{1}{2} \times 2 \times (5 + 1)\right)\) |
| 56 (square units) | A1 | CAO |
| Scheme | Marks | Comments |
|---|---|---|
| Overestimate with valid reason e.g. ‘(The curve is convex so) the area of under the curve for each strip is less than the area of the trapezium estimating that area.’ | E1 | Allow e.g. ‘The trapeziums are above the curve’ or ‘The curve is convex’ Comments must be based on an attempt to find the area using 4 vertical strips in (a) |
| (5) |