(a) Battery life is the length of time for which a battery can be used before it needs to be recharged.
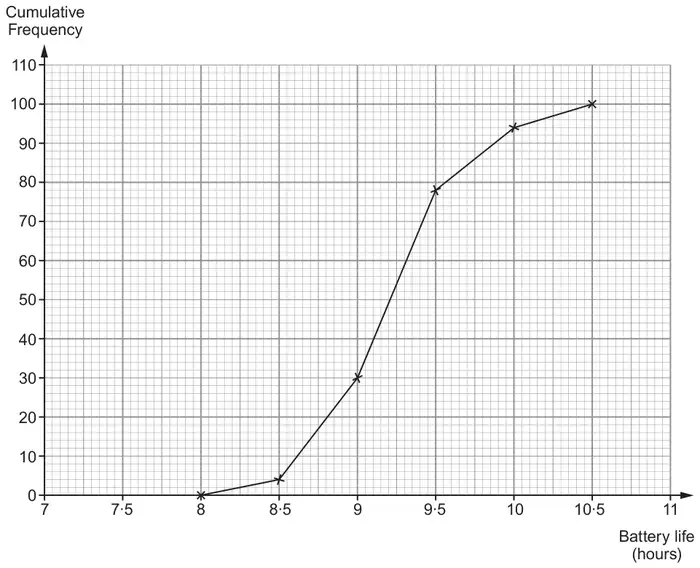
One hundred users of the LitestarA tablet computer each recorded the battery life of their tablet. The diagram shows the distribution of the battery lives recorded, in hours.
(i) How many of these LitestarA tablet computers had a battery life of more than 9·5 hours? [1]
(ii) Use the diagram to complete the table for these LitestarA tablet computers. [3]
Median
Lower Quartile
Upper Quartile
Inter-quartile Range
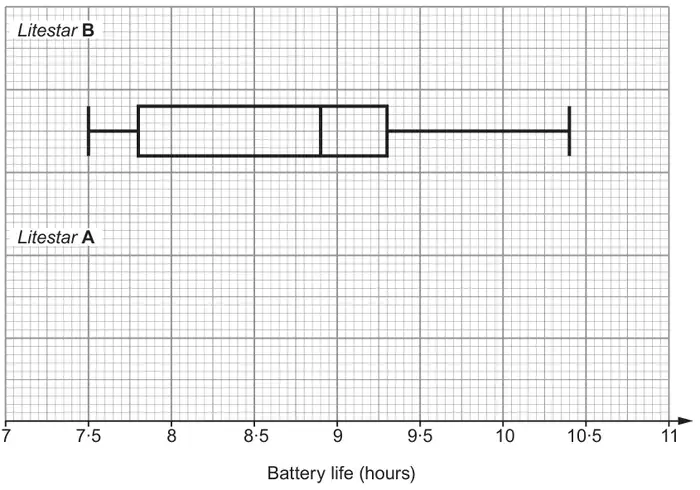
(b) This box plot shows the distribution of the battery lives recorded by one hundred users of LitestarB tablet computers.
(i) For the LitestarA tablet computers:
The shortest battery life recorded was 8 hours.
The longest battery life recorded was 10·4 hours.
Using this information and the information from part (a), draw the box plot for the LitestarA tablet computers on the grid above. [2]
(ii) Neena wants to buy one of these tablet computers. She wants the best battery life possible.
Should Neena buy a LitestarA or LitestarB tablet computer?
LitestarA ☐ LitestarB ☐
Give a reason for your decision. [1]
Mark scheme (a)
Scheme
Marks
Comments
(i) 22
B1
(ii)
M
LQ
UQ
IQR
9.2
8.9
9.4 to 9.5
0.5 to 0.6
B3
B1 for correct median
B1 for correct LQ and UQ
B1 FT for correct IQR; FT ‘their UQ’ – ‘their LQ’ provided one is correct
Mark scheme (b)
Scheme
Marks
Comments
(i) Correct box plot: Whiskers from 8 to 10.4 Box from 8.9 to (9.4 to 9.5) Median at 9.2
B2
FT their values from (a)(ii)
B1 FT for 2 out of 3 correct from whiskers, box, median
(ii) Litestar A and a correct reason. e.g. ‘She should buy tablet A as the median is greater (than tablet B).’ or ‘She should buy tablet A as the median is 0.3 hours more (than tablet B).’ or ‘She should buy tablet A as the shortest battery life is ½ hour greater.’ or ‘Tablet A as the Lower quartile is more than the lower quartile of tablet B.’
E1
FT their values from (a)(ii) or their box plot from (b)(i)
Allow ‘Every statistic apart from the highest value is greater for Litestar A than for Litestar B.’
We'd like to use Google Analytics cookies to count visits and see which pages help most. They're optional, and the site works exactly the same either way. Privacy policy