
Higher June 2018 Paper 1 Q1
1. The graph shows information about the percentage of waste composted by Molehill District Council from 2002 to 2014.
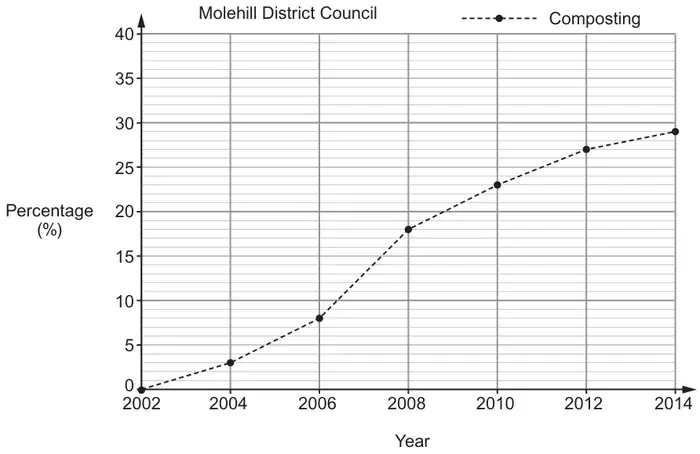
The table shows information about the percentage of waste recycled by Molehill District Council from 2002 to 2014.
| Year | 2002 | 2004 | 2006 | 2008 | 2010 | 2012 | 2014 |
|---|---|---|---|---|---|---|---|
| Recycling (%) | 15 | 18 | 32 | 36 | 32 | 30 | 27 |
(a) On the grid above, plot the data for recycling. [1]
(b)
(i) The mayor of Molehill says,
‘One year, the percentage of waste recycled was 6 times the percentage of waste composted.’
Write down the year for which this comment is correct. [1]
(ii) Between which two years did the percentage of waste composted increase the most? [1]
Between ………… and …………
(iii) Using the information provided, write one comment, comparing how the percentages of waste recycled and composted have changed between 2002 and 2014. [1]
| Scheme | Marks | Comments |
|---|---|---|
| Correct plot | P1 | May or may not be joined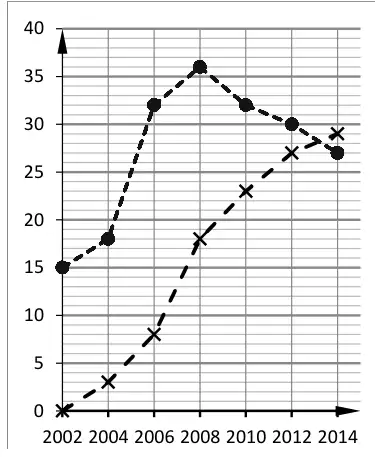 |
| Scheme | Marks | Comments |
|---|---|---|
| (i) 2004 | B1 | |
| (ii) 2006 and 2008 | B1 | |
| (iii) Any valid comparison. e.g. ‘The composting percentage is always increasing but the recycling percentage increases (until 2008) but then decreases.’ or ‘From 2012 the recycling and composting rates are about the same.’ or ‘From 2002 to 2008 both rates are increasing but after 2008 the recycling rate decreases whereas the composting rate keeps on increasing.’ or ‘The recycling rate is more than the composting rate until 2012 but in 2014 a greater % of waste is composted than recycled.’ or ‘More waste is recycled than is composted until 2012. (After that there is about the same amount of each).’ | E1 | A comparison does not need to mention the years but must mention composting and recycling. Allow e.g. ‘Waste recycled has eventually begun to fall where compost has continued to gradually rise, (eventually taking over recycled waste)’ or ‘As the percentage of composting has increased the percentage of recycling has declined from 2008’ or ‘More waste is being recycled and composted in 2014 than in 2002’ or ‘Both the waste recycling and composting have increased between 2002 and 2014’ |
| (4) |