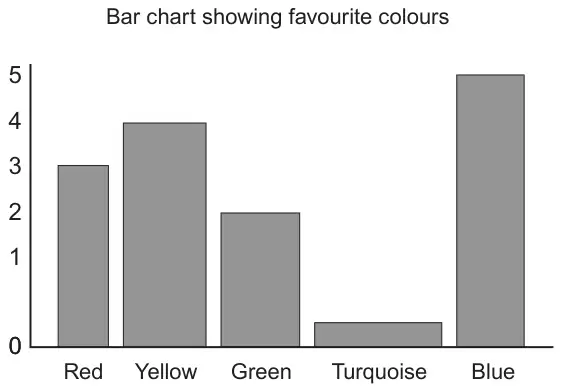
Michael drew the bar chart below to show some children’s favourite colours.
Write down two criticisms of this bar chart. [2]
First criticism:
Second criticism:
(b)
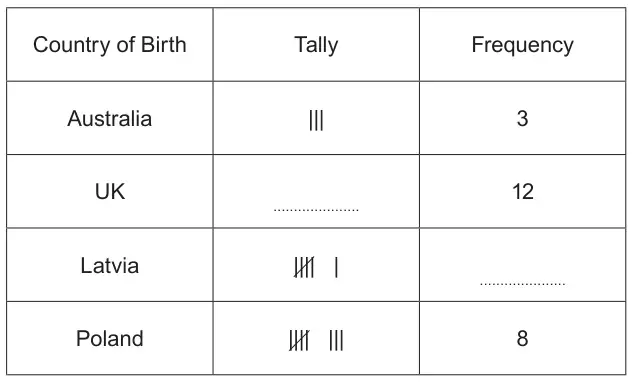
The table below shows the country of birth of all students in Michael’s tutor group.
(i) Complete the table. [1]
(ii) On the grid below, draw a bar chart to show the information in the table. [2]
Bar chart showing the country of birth
Mark scheme (a)
Scheme
Marks
Comments
Two criticisms of the presentation of the graph, e.g. ‘bars are different widths’ ‘vertical scale is not uniform’ ‘axes not labelled (frequency)’ ‘can’t have less than 1 child (turquoise)’
E2
E1 for only one correct statement. Do not accept ‘bars (of) different sizes’ unless it is clear they mean widths.
Mark scheme (b)
Scheme
Marks
Comments
(i) and 6 filled in correctly
B1
(ii) Correctly drawn bar graph. Uniform scale and labelled axes
We'd like to use Google Analytics cookies to count visits and see which pages help most. They're optional, and the site works exactly the same either way. Privacy policy