
Foundation June 2024 Paper 2 Q16
16. 45 students took part in a 400 m race.
Their times, in seconds, were recorded.
The frequency diagram below shows the results.
The groups used are as follows:
\(70 \leqslant \text{time} \lt 80\), \(80 \leqslant \text{time} \lt 90\), \(90 \leqslant \text{time} \lt 100\), \(100 \leqslant \text{time} \lt 110\) and \(110 \leqslant \text{time} \lt 120\).
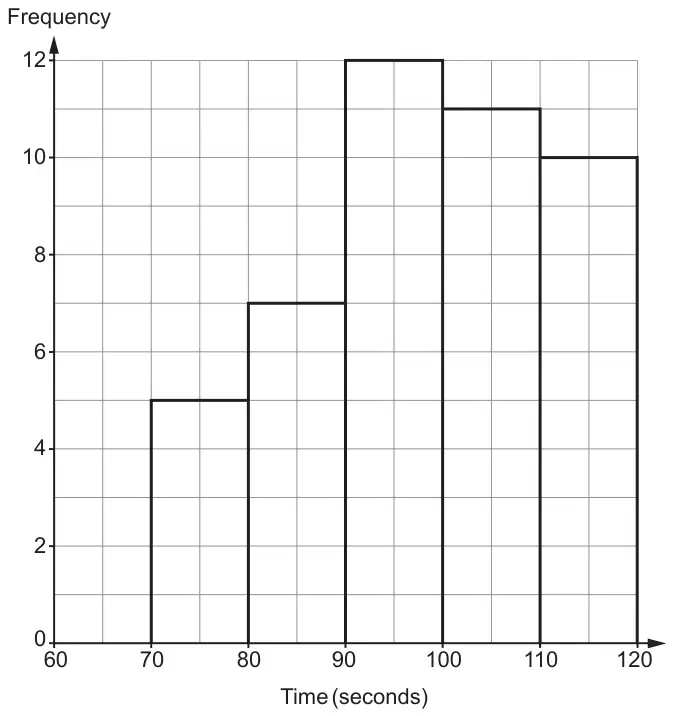
Calculate an estimate for the mean time it took to complete the race. [5]
| Scheme | Marks | Comments |
|---|---|---|
| Mid-points: 75, 85, 95, 105, 115 | B1 | May be implied from correct totals, see below. |
| 75 × 5 + 85 × 7 + 95 × 12 + 105 × 11 + 115 × 10 | M2 | FT ‘their mid-points’ provided at least 4 of these are at the bounds or within the groups 375 + 595 + 1140 + 1155 + 1150 (= 4415) M1 for the addition of five products allowing one error with the frequencies. If mid-points are not given, then no marks except for the following cases:
|
| ÷ 45 | m1 | |
| \(98\frac{1}{9}\) or \(\frac{883}{9}\) or 98.1(1…) (seconds) | A1 | FT provided M2 m1 awarded, for the correct evaluation using their mid-points Allow 98 from correct working. Allow truncated or rounded decimal FT answers. |
| (5) |