
Foundation June 2019 Paper 1 Q4
4.
(a)
(i)
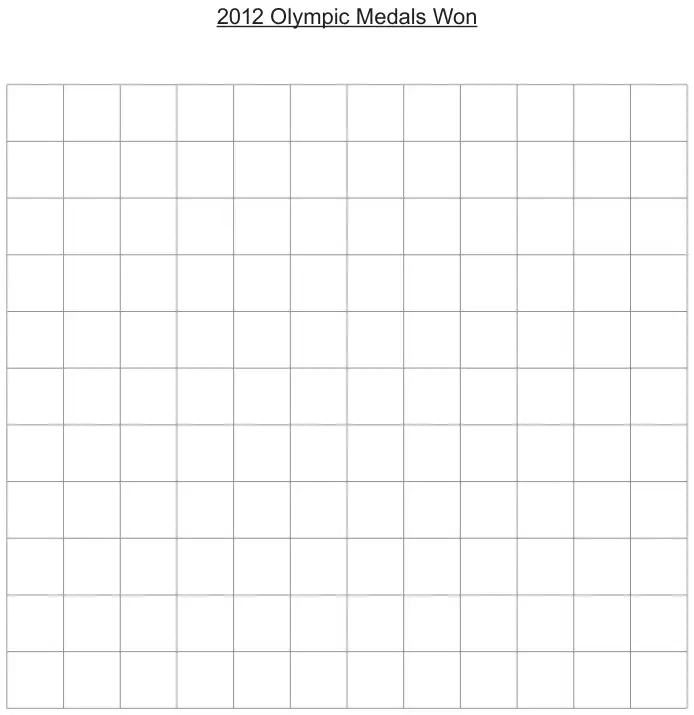
This table shows the total number of medals won by four countries in the 2012 London Olympic Games.
| Country | Number of medals |
|---|---|
| Brazil | 17 |
| Kenya | 12 |
| Jamaica | 12 |
| South Africa | 6 |
Draw a bar chart to show this information. [3]
(ii) 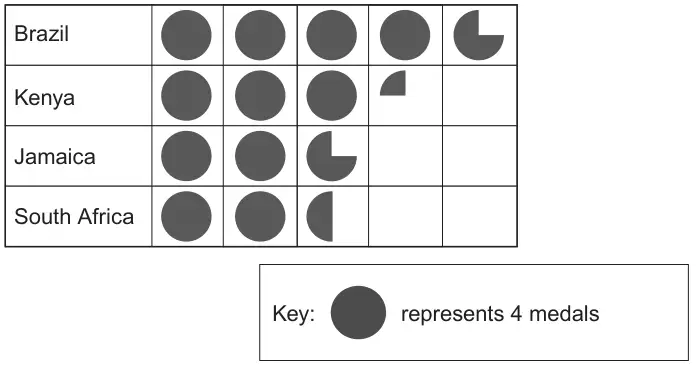
The pictogram shows the total number of medals won by the same four countries in the 2016 Rio Olympic Games.
Use the information given in the table and pictogram to complete the sentences below:
The total number of medals won by Brazil in 2016 is ................ more than they won in 2012.
The total number of medals won by .............................. in 2016 is 4 more than they won in 2012. [2]
(b)
In 2016, the total of gold, silver and bronze medals won by China was 70.
They won:
- 18 silver medals,
- the same number of gold medals as they did bronze medals.
How many gold medals did China win? [2]
| Scheme | Marks | Comments |
|---|---|---|
| (i) Labels on both axes | B1 | horizontal axis labels may be on bars; at least the bars labelled with the country names; allow abbreviations e.g. B, K, J, S |
| Uniform scale on vertical axis | B1 | at least 2 values; must start with 0 |
| All bars of equal width and correct height | B1 | heights: 17, 12, 12, 6 mark intent allow inconsistent-width gaps or no gaps |
| (ii) 2 South Africa | B2 | B1 for each; allow abbreviations for South Africa if clear |
| Scheme | Marks | Comments |
|---|---|---|
| (70 – 18) ÷ 2 | M1 | May be in stages |
| 26 | A1 | If no marks then SC1 for two improving trials on \(x + x\) + 18 = 70 oe |
| (7) |