
S1 June 2013 (R) Q6
6.
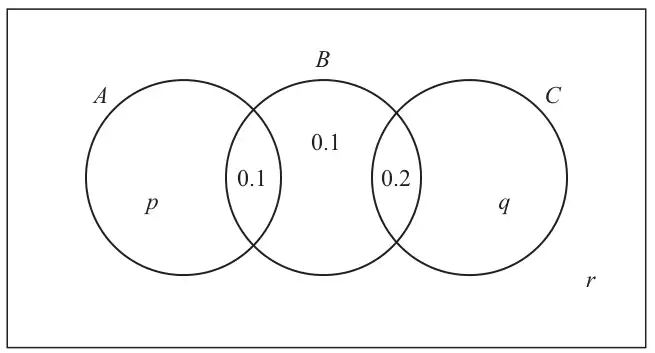
The Venn diagram in Figure 1 shows three events \(A\), \(B\) and \(C\) and the probabilities associated with each region of \(B\). The constants \(p\), \(q\) and \(r\) each represent probabilities associated with the three separate regions outside \(B\).
The events \(A\) and \(B\) are independent.
Given that \(\mathrm{P}(B \mid C) = \dfrac{5}{11}\)
| Scheme | Marks |
|---|---|
| \([\mathrm{P}(B) = 0.4,\ \mathrm{P}(A) = p + 0.1\) so] \(0.4\times(p + 0.1) = 0.1\) or \(0.4\times\mathrm{P}(A) = 0.1\) | M1 |
| \(p = \dfrac{1}{4} - 0.1\) \(\boldsymbol{p}\) = 0.15 | M1A1 |
| (3) |
Notes
1st M1 for using independence in an attempt to form an equation in \(p\) or \(\mathrm{P}(A)\)
2nd M1 for a correct attempt to solve their linear equation leading to \(p = \ldots\)
A1 for 0.15 or exact equivalent
| Scheme | Marks |
|---|---|
| \(\dfrac{5}{11} = \left[\dfrac{\mathrm{P}(B \cap C)}{\mathrm{P}(C)} =\right] \dfrac{0.2}{0.2 + q}\) or \(\dfrac{5}{11} = \dfrac{0.2}{\mathrm{P}(C)}\) | M1 |
| \(11\times 0.2 = 5\times(0.2 + q)\) | dM1 |
| \(\boldsymbol{q}\) = 0.24 | A1 |
| \(r = 0.6 - (p + q)\) i.e. \(\boldsymbol{r}\) = 0.21 | A1ft |
| (4) |
Notes
1st M1 for a clear attempt to use \(\mathrm{P}(B \mid C)\) to form an equation for \(q\) or \(\mathrm{P}(C)\). Assuming indep M0
2nd dM1 Dep. on 1st M1 for correctly simplifying to a linear equation in \(q\) or \(\mathrm{P}(C)\) e.g. accept \(11\times 0.2 = 5\times 0.2 + q\) or \(5\mathrm{P}(C) = 2.2\)
1st A1 for \(q = 0.24\) or exact equivalent
2nd A1ft for 0.6 – their \((p + q)\) Dependent on 1st M1 in (b) only.
| Scheme | Marks |
|---|---|
| \(\left[\dfrac{\mathrm{P}((A \cup C) \cap B)}{\mathrm{P}(B)}\right] = \dfrac{0.3}{0.4}\) | M1 |
| \(= \underline{\mathbf{0.75}}\) | A1 |
| (2) | |
| (9 marks) |
Notes
M1 for a correct ratio expression and one correct value (num < denom) or a fully correct ratio. Allow \(\dfrac{\mathrm{P}(A \cup C \cap B)}{\mathrm{P}(B)}\) with one probability correct but only if num < denom. A numerator of \(\mathrm{P}(A \cup C)\times\mathrm{P}(B)\) scores M0
A1 for 0.75 or an exact equivalent