
S1 June 2012 Q3
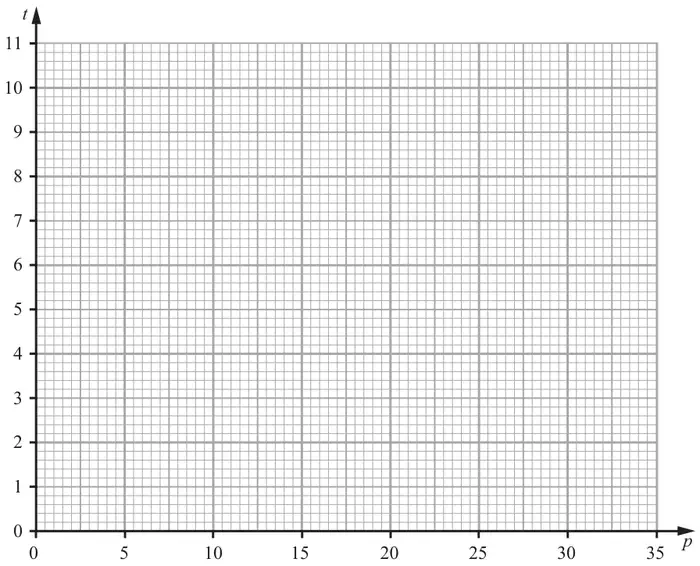
3. A scientist is researching whether or not birds of prey exposed to pollutants lay eggs with thinner shells. He collects a random sample of egg shells from each of 6 different nests and tests for pollutant level, \(p\), and measures the thinning of the shell, \(t\). The results are shown in the table below.
| \(p\) | 3 | 8 | 30 | 25 | 15 | 12 |
|---|---|---|---|---|---|---|
| \(t\) | 1 | 3 | 9 | 10 | 5 | 6 |
[You may use \(\sum p^2 = 1967\) and \(\sum pt = 694\)]
The scientist reviews similar studies and finds that pollutant levels above 16 are likely to result in the death of a chick soon after hatching.
| Scheme | Marks |
|---|---|
 | B1 B1 |
| (2) |
Notes
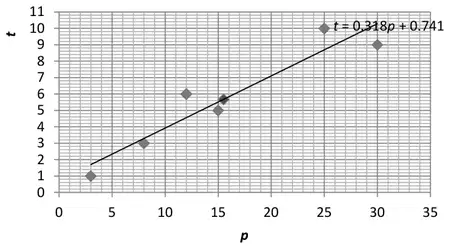
B2 for all 6 data points plotted correctly. B1 for any 5 correct. Points not wholly outside the circles.
| Scheme | Marks |
|---|---|
| Points (appear to) lie close to a (straight) line or “strong /high correlation” | B1 |
| (1) |
| Scheme | Marks |
|---|---|
| \(\sum p = 93\) and \(\sum t = 34\) (may be seen in table) | M1 |
| \(S_{pt} = 694 - \dfrac{\text{"}93\text{"}\times\text{"}34\text{"}}{6} = [167]\) or \(S_{pp} = 1967 - \dfrac{\text{"}93\text{"}^2}{6} = [525.5]\) | M1 |
| \(S_{pt} = 167\); \(S_{pp} =\) awrt 526 | A1; A1 |
| (4) |
Notes
1st M1 for attempting \(\sum p\) and \(\sum t\). Allow \(80 \lt \sum p \lt 100\) and \(30 \lt \sum t \lt 40\)
2nd M1 for one correct expression for \(S_{pt}\) or \(S_{pp}\), f.t. their \(\sum p\) and \(\sum t\).
1st A1 for \(S_{pt}\)
2nd A1 for \(S_{pp}\)
| Scheme | Marks |
|---|---|
| \(b = \left[\dfrac{S_{pt}}{S_{pp}} =\right] \dfrac{\text{"}167\text{"}}{\text{"}525.5\text{"}} = [0.31779\ldots]\) (check their answer if expression not seen) | B1ft |
| \(a = \dfrac{\text{"}34\text{"}}{6} - \text{"}0.31779\ldots\text{"}\times\dfrac{\text{"}93\text{"}}{6} = 5.666\ldots - 0.31779\ldots\times 15.5 =,\ 0.74088\ldots\) awrt 0.74 | M1, A1 |
| \(\boldsymbol{t = 0.741 + 0.318p}\) (Accept \(a = \frac{2336}{3153}\) and \(b = \frac{334}{1051}\) in their equation) | A1 |
| (4) |
Notes
B1ft for correct expression for the gradient, f.t. their 167 and 525.5 from (c)
M1 for correct use of \(a = \bar{t} - b\bar{p}\) f.t. their values. Condone 5.6 for \(\bar{t}\)
1st A1 for awrt 0.74 NB use of 526 gives 0.745566… and gets A0
2nd A1 for a correct equation for \(t\) in terms of \(p\) with \(a\) and \(b\) awrt 3sf. An equn in \(y\) or \(x\) is A0
| Scheme | Marks |
|---|---|
| \((\bar{p}, \bar{t}) = (15.5, 5.7)\) plotted on the graph (not wholly outside the circle) | B1 |
| Correct line plotted as per overlay. For \(p = 5\); \(2 \lt t \lt 3\) and for \(p = 30\); \(10 \lt t \lt 11\) Their line must stretch roughly as far as the points and go through the \((\bar{p}, \bar{t})\) circle | B1 |
| (2) |
| Scheme | Marks |
|---|---|
| \(t = \text{"}0.741\text{"} + \text{"}0.318\text{"}\times 16\) | M1 |
| \(= 5.825\ldots\) awrt 5.8 | A1 |
| (2) | |
| (15 marks) |
Notes
M1 for clear use of their line (equation or on graph) and \(p = 16\) to estimate \(t\). This may be an expression or lines marked on the diagram
A1 for awrt 5.8, even if their line is not fully correct. Accept “\(t \gt 5.8\)”(oe). Answer only 2/2