
S1 January 2010 Q7
7. The heights of a population of women are normally distributed with mean \(\mu\) cm and standard deviation \(\sigma\) cm. It is known that 30% of the women are taller than 172 cm and 5% are shorter than 154 cm.
A woman is chosen at random from the population.
| Scheme | Marks |
|---|---|
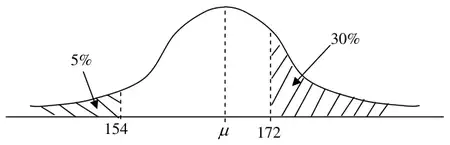 | |
| bell shaped, must have inflexions | B1 |
| 154,172 on axis | B1 |
| 5% and 30% | B1 |
| (3) |
Notes
2nd B1 for 154 and 172 marked but 154 must be < \(\mu\) and 172 > \(\mu\). But \(\mu\) need not be marked.
Allow for \(\tfrac{154-\mu}{\sigma}\) and \(\tfrac{172-\mu}{\sigma}\) marked on appropriate sides of the peak.
3rd B1 the 5% and 30% should be clearly indicated in the correct regions i.e. LH tail and RH tail.
| Scheme | Marks |
|---|---|
| \(\mathrm{P}(X \lt 154) = 0.05\) | |
| \(\dfrac{154 - \mu}{\sigma} = -1.6449\) or \(\dfrac{\mu - 154}{\sigma} = 1.6449\) | M1 B1 |
| \(\mu = 154 + 1.6449\sigma\) **given** | A1 cso |
| (3) |
Notes
M1 for \(\pm\dfrac{(154 - \mu)}{\sigma} = z\) value (\(z\) must be recognizable e.g. 1.64, 1.65, 1.96 but NOT 0.5199 etc)
B1 for \(\pm\) 1.6449 seen in a line before the final answer.
A1cso for no incorrect statements (in \(\mu\), \(\sigma\)) equating a z value and a probability or incorrect signs
e.g. \(\tfrac{154-\mu}{\sigma} = 0.05\) or \(\tfrac{154-\mu}{\sigma} = 1.6449\) or \(\mathrm{P}(Z \lt \tfrac{\mu-154}{\sigma}) = 1.6449\)
| Scheme | Marks |
|---|---|
| \(172 - \mu = 0.5244\sigma\) or \(\dfrac{172 - \mu}{\sigma} = 0.5244\) (allow \(z\) = 0.52 or better here but must be in an equation) | B1 |
| Solving gives \(\sigma = 8.2976075\) (awrt 8.30) and \(\mu = 167.64873\) (awrt 168) | M1 A1 A1 |
| (4) |
Notes
B1 for a correct 2nd equation (NB \(172 - \mu = 0.525\sigma\) is B0, since \(z\) is incorrect)
M1 for solving their two linear equations leading to \(\mu = \ldots\) or \(\sigma = \ldots\)
1st A1 for \(\sigma\) = awrt 8.30, 2nd A1 for \(\mu\) = awrt 168 [NB the 168 can come from false working. These A marks require use of correct equation from (b), and a \(z\) value for “0.5244” in (c)]
NB use of \(z\) = 0.52 will typically get \(\sigma\) =8.31 and \(\mu\) = 167.67… and score B1M1A0A1
No working and both correct scores 4/4, only one correct scores 0/4
Provided the M1 is scored the A1s can be scored even with B0 (e.g. for \(z\) =0.525)
| Scheme | Marks |
|---|---|
| P(Taller than 160cm) \(= \mathrm{P}\left(Z \gt \dfrac{160 - \mu}{\sigma}\right)\) | M1 |
| \(= \mathrm{P}(Z \lt 0.9217994)\) | B1 |
| \(= 0.8212\) awrt 0.82 | A1 |
| (3) | |
| (13 marks) |
Notes
M1 for attempt to standardise with 160, their \(\mu\) and their \(\sigma\) (> 0). Even allow with symbols \(\mu\) and \(\sigma\).
B1 for \(z\) = awrt \(\pm\) 0.92
No working and a correct answer can score 3/3 provided \(\sigma\) and \(\mu\) are correct to 2sf.